Automatize Platform
Redesign the user interface for supply chain software company to create an overall better and more intuitive user experience. Fleet management platform focused on travel optimization.
When developing a map-based interface it is important to create a visual hierarchy among the content to give fleet managers an intuitive way to find vehicles, understand delays or mechanical issues, and to create greater efficiencies among vehicles. Our interface design provides all of this and more for Automatize telematics and supply chain software.
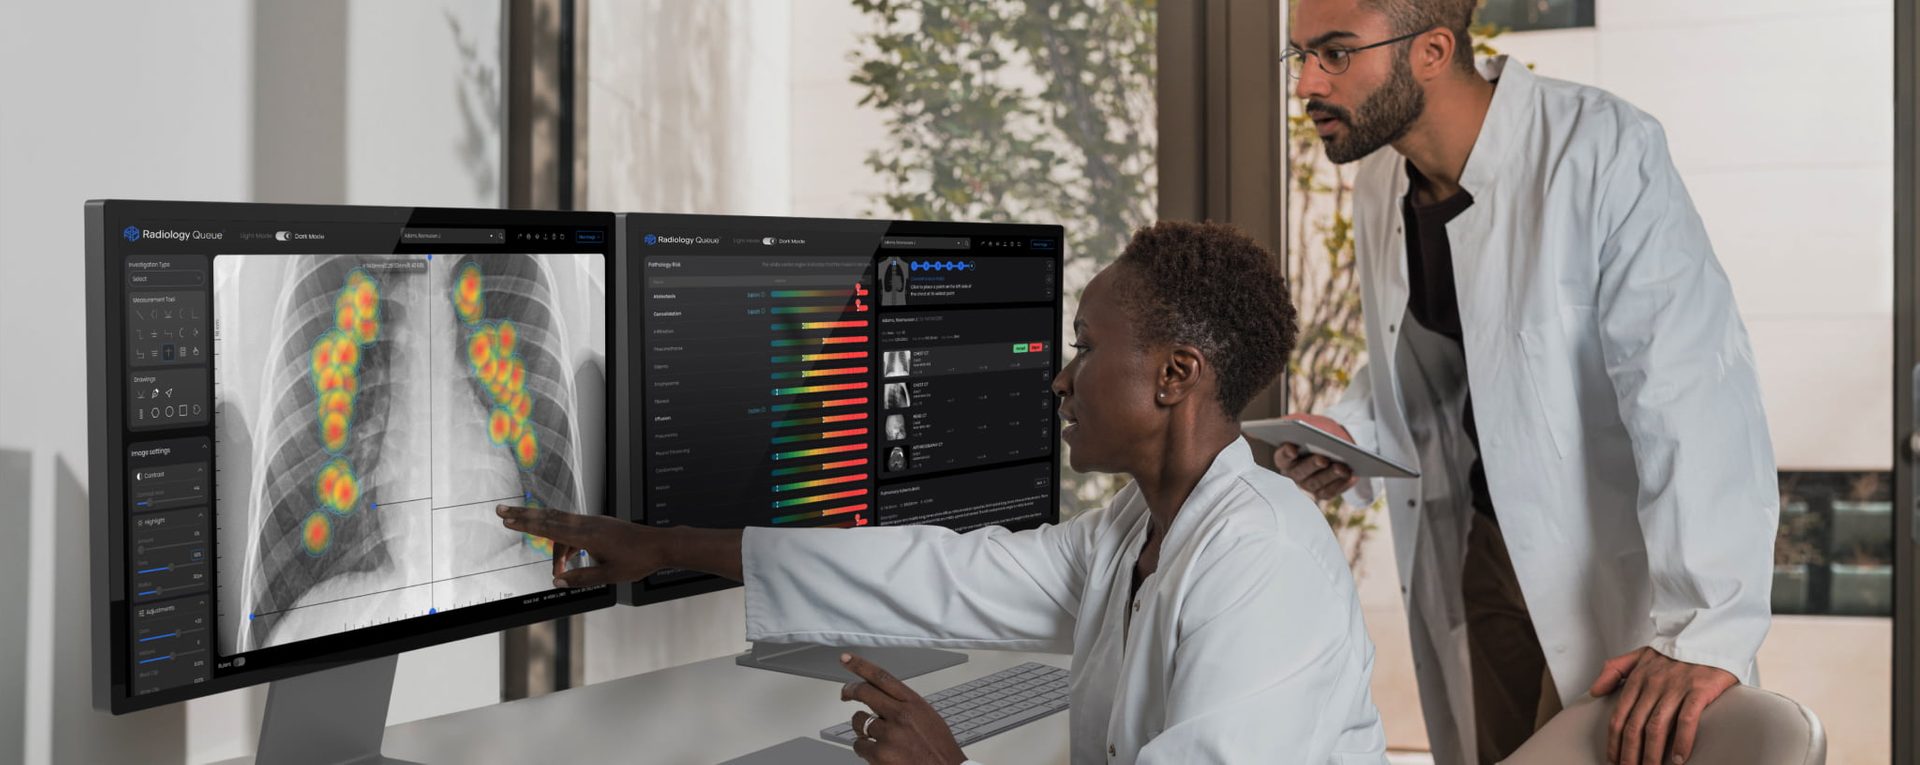
Digital Interface for Telematics & Supply Chain
The platform should enable real-time tracking of vehicles, allowing fleet managers to monitor their locations, routes, and status at any given time. This data will be used for analysis and decision-making. Provide comprehensive data analysis and reporting capabilities, including key performance indicators (KPIs) such as fuel efficiency, maintenance costs, driver performance, and overall fleet utilization. The platform should present this information in user-friendly dashboards and reports.

Challenge
Design an automatized platform for fleet management that optimizes efficiency, reduces costs, and enhances the overall operational performance of a fleet of vehicles.

Strategy
The interface design includes an analysis module to allow fleet owners and managers the ability to continuously monitor their fleet movements. Designed an intuitive and user-friendly interface that simplifies fleet management tasks, providing easy access to relevant information and enabling efficient decision-making.
Fleet management platform focused on travel optimization
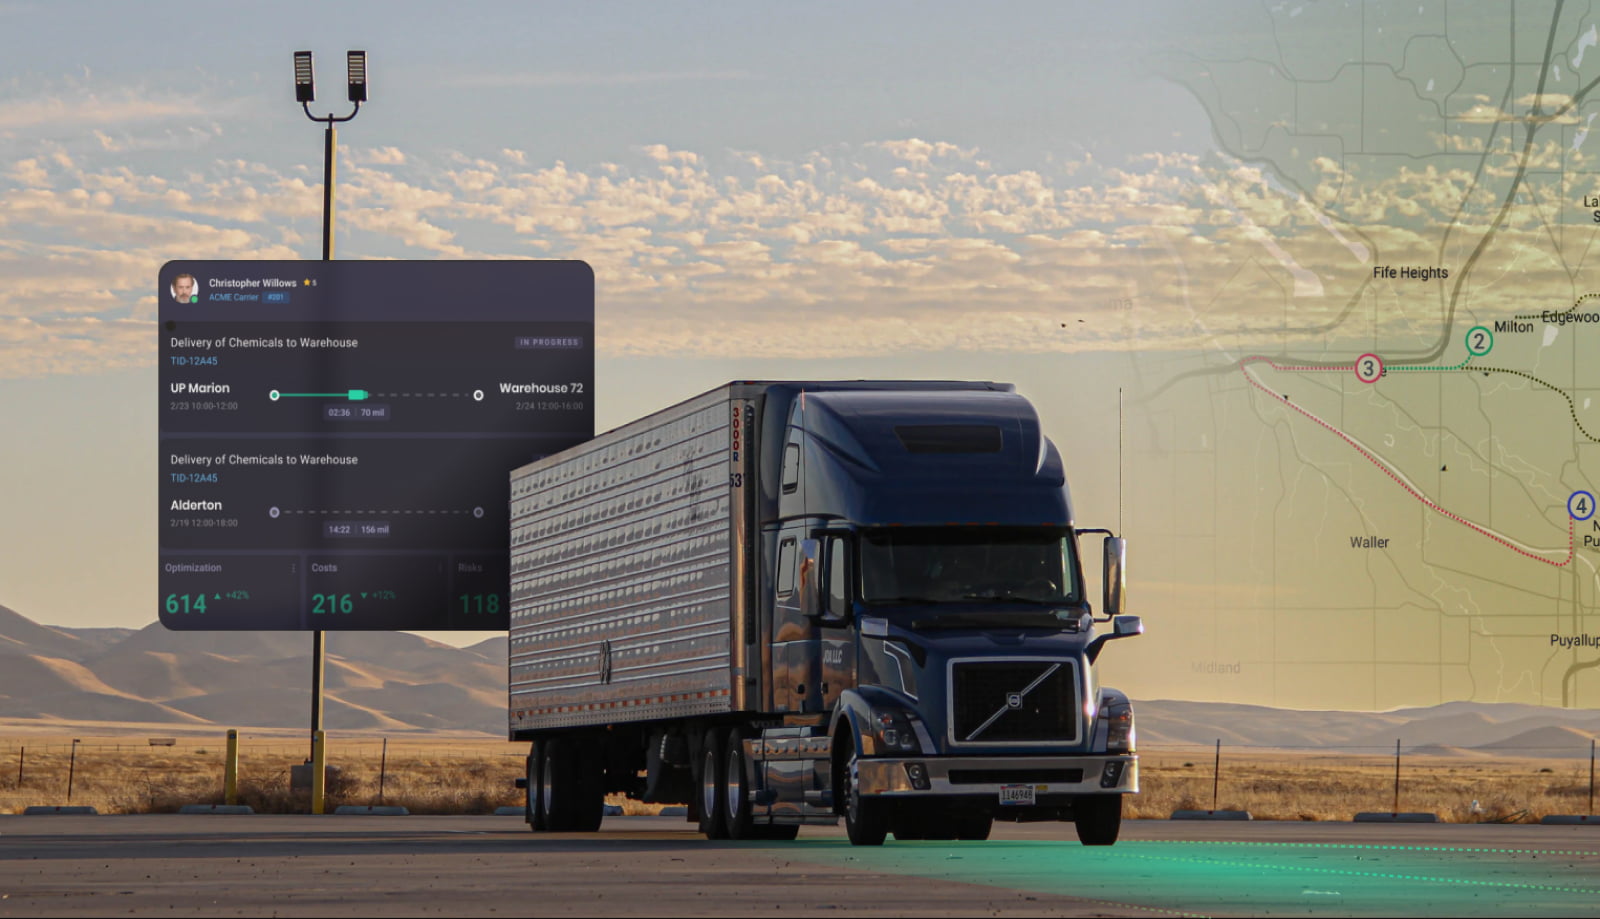
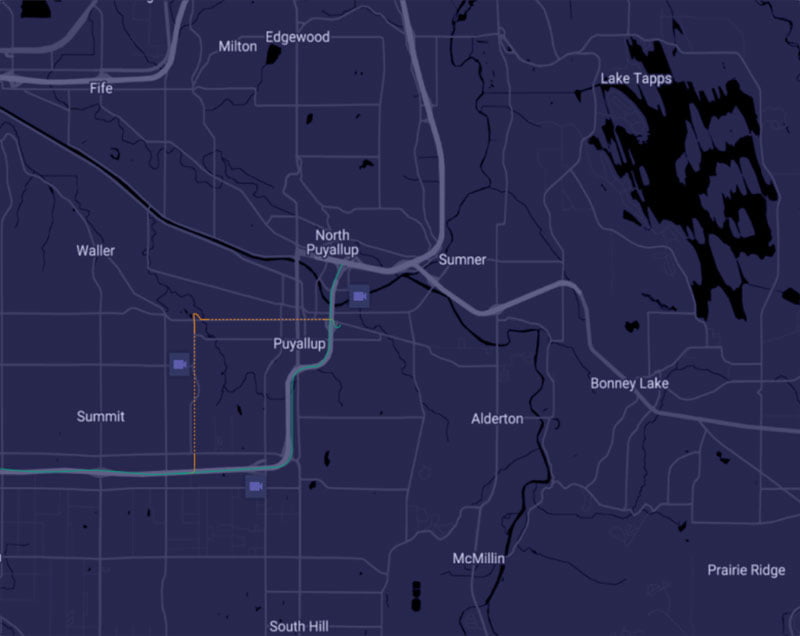
- Live geolocation map with real-time truck movements. Whether a fleet manager wants to see real-time data on a particular vehicle or the entire fleet all at once, our map-based interface provides all the drill-down information a manager needs to properly and efficiently manage a fleet of trucks.
- Fleet management comes down to cost and time. To understand the profitability of your fleet, our real-time interface includes hover information for each vehicle, allowing for optimization of individual trips and cost cutting measures.
- Realtime analytics with actionable insights. The interface design Fuselab created for Automatize includes an analysis module to allow fleet owners and managers the ability to continuously monitor their fleet movements.


Automatize Platform
Three key components were incorporated into our interface design, geolocation tracking, speed and travel time of individual trips, and the ability to produce analytics to better understand and address efficiency issues and to quickly notify management of equipment or trip issues that need to be addressed.
Whether a fleet manager wants to see real-time data on a particular vehicle or the entire fleet all at once, our map-based interface provides all the drill-down information a manager needs to properly and efficiently manage a fleet of trucks.
To understand the profitability of your fleet, our real-time interface includes hover information for each vehicle, allowing for optimization of individual trips and cost cutting measures.
The interface design Fuselab created for Automatize includes an analysis module to allow fleet owners and managers the ability to continuously monitor their fleet movements and address issues with laser-like focus.

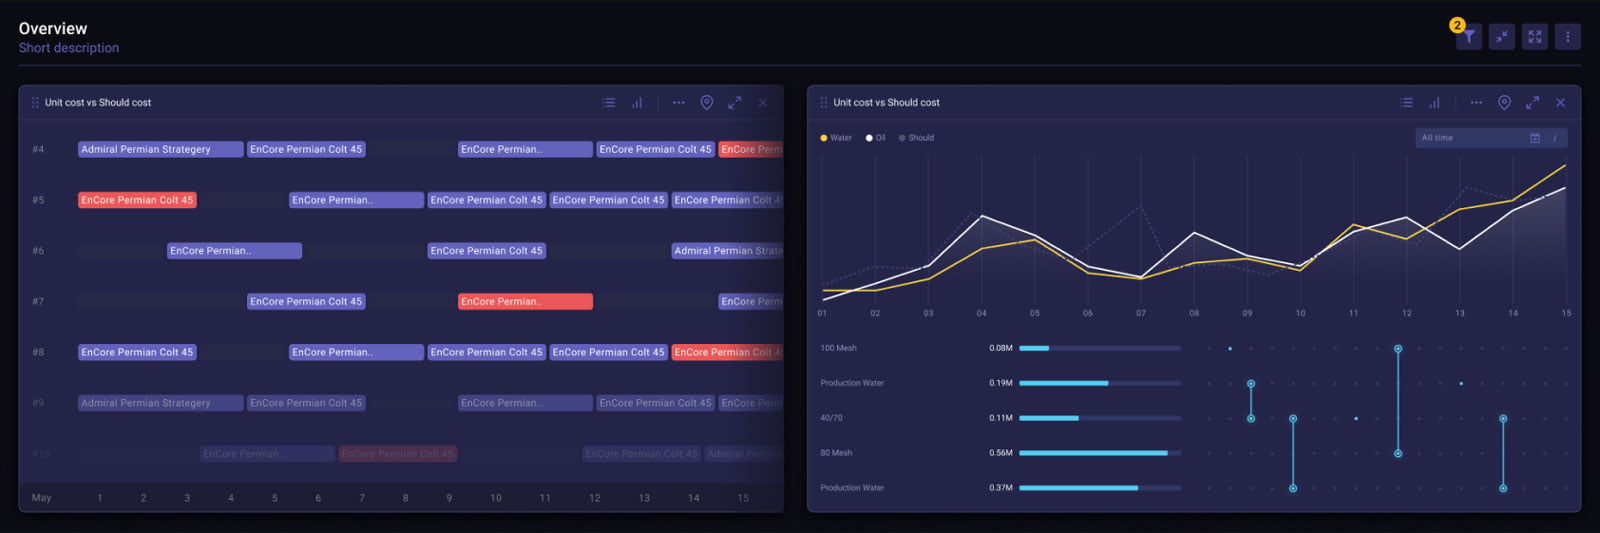
All-In-One Dashboard Design
We first designed a live map with individual vehicle locations, fuel consumption, trip time, and tasks, but this is only some of the high-level elements developed. Every module has been made expandable to view elaborately detailed views and live hover windows were also employed for every moving vehicle.
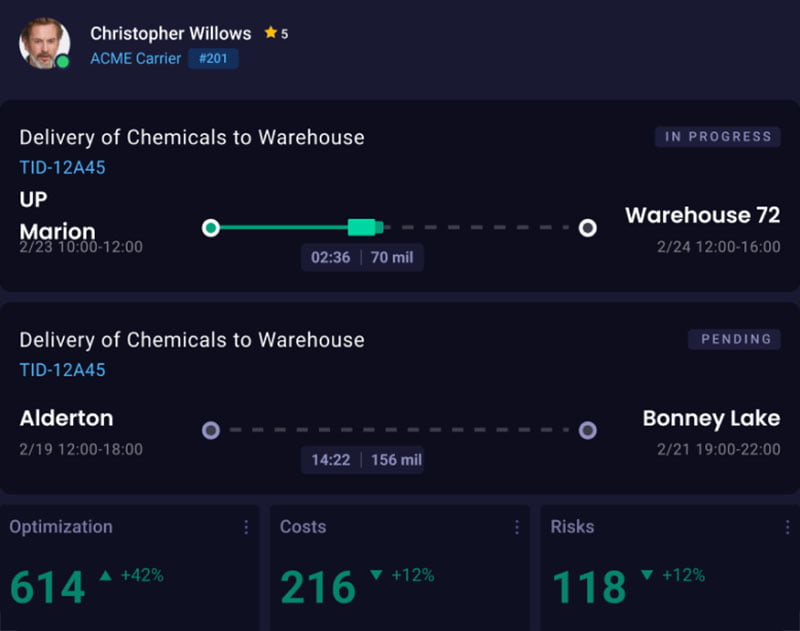
A simple yet extremely effective card design for each critical area of information.
Individual Task & Trip View
Understanding the stages of trips, such as staging, unloading, loading, fueling, and travel time all play a role in fleet optimization and management. The projects and tasks module we designed also needed to include an automated billing and accounting system that enables users to see real-time profit and areas of needed change.
Stages of trips, such as staging, unloading, loading, fueling, and travel time.
Project Overview
Again using a live map as a the foundational informational component of our interface design, individual floating cards can be opened, expanded and closed to better understand each task, trip and project with few simple clicks.

All information needed to manage your fleet from one dashboard view.

Tablet View
The adaptive design we created for this platform needed to provide the same level of informational access within smaller tablet screens, as managers are often outside or on the move and needed to be able to see vehicle and project status in order to assign new tasks, close-out current projects and track billing.

Telematics & Supply Chain
Putting fleet management in the driver’s seat by giving them actual live views of the truck data, traffic, and road conditions, took this design and the Automatize platform to an entirely new level in terms of dashboard visuals.
Tasks, purchase orders, and payments: where the rubber hits the road.
Every trip and its individual analytics are available at all times to allow for last-minute changes.
Not all roads are the same, which is why travel route options can be the key to improving efficiencies.
Project-level management
Our dashboard design for fleet management focused on visually tracking vehicle movements from point A to point B. Many fleet movements are multi-layered, including multiple stops, timed arrivals, and pre-determined fuel costs based on specific profit margins, which are all accessible in realtime via hovers.
Truck driving isn’t always just about driving; in fact, it often includes other tasks along with travel requirements. A simple yet intuitive interface allows for tasks to be added or deleted to a trip and monitored in terms of timeliness and successful completion or failure and why.
Travel management can be a messy business, as flat tires, mechanical failures, highway and road closures, and the list goes on. Our interface design provides a detailed view of where your trucks are, current mechanical status, and trip efficiencies, all within a few clicks.
The design we created included many levels of information from the simple landing page as well as the ability to drill-down on specific areas, trips and vehicles to better understand the efficiencies of your fleet and it’s ablility to deliver.
Designed by:
Art Direction
George Railean
Product Design
Marcel Sendrea
Project management
Vladimir Bobu
Do you want to create something similar?
Get a free estimation for your project requirements and start it within 24 hours.