Radiology Queue

Digital Product Design Agency, we are a group of UX/UI designers seeking to inspire our clients through transformational design strategy and creating beautiful digital products.
Every collaborator who enters our orbit brings with him or her a world more strange and complex than any we could ever hope to imagine. By listening to the details and the subtlety of their needs, desires, or ambitions, we fold their world onto our own. Neither party will ever be the same. Bruce Mau has described our interaction with every client perfectly in the words above.
How can we take
what is currently available in the XR Health space and make it more effective?

Challenge
Create an interactive software platform for x-ray specialists to review scans and annotate with notes, measurements, and/or approvals or rejections for medical providers. Most technicians never speak to the medical provider, so all the information needs to be extremely clear and easy for providers from all areas of the care workflow to make use of the information provided.

Strategy
Develop a UX/UI design that allows medical providers to easily scan through documentation and then be able to confirm the diagnosis through their own view of the same x-ray. Equally important, was the ability for the medical provider to communicate with the radiology clinic when needed when they had any further questions or needed another scan to be performed.
User Flow
Each function and opportunity for documentation within the platform was spelled out in detail to leave no questions for our development team once the design was complete.


Radiology Queue
For radiology management staff a content management system and administrative panel were designed with detail on when, what, and how each scan was performed and the results provided, and to who. The user experience needed to make patient selection, sharing, and editing as effortless as possible. Such as adding a sorting feature based on dates, searching by name, or by medical provider.

Tools
Multiple tools were created to give technicians a large suite of options to use to explain their analysis, such as drawing features and the ability to add color for visual clarity.
Multiple tools were created to give technicians a large suite of options to use to explain their analysis, such as drawing features and the ability to add color for visual clarity.

Every scan is different, just as every human being is different. Therefore, we also added a multi-dimensional image setting panel to create highlights, improve contrast, adjust the density, and separate tones to better elucidate what the image has to convey to the provider.
Contrast
Highlight
Adjustments
Truncate

The cardiothoracic ratio aids in the detection of enlargement of the cardiac silhouette, which is most commonly from cardiomegaly but can be due to other processes such as a pericardial effusion. Getting the proper scan to determine this ratio from a PA chest x-ray can be a challenge and the exact measurement is really never possible, but we attempted to provide technicians with the visual tools designed to provide the most precise measurements possible.

Manual
Measurement
Most of the work on an X-ray analysis is done manually, although more and more AI-related functionality is being developed every day. Technicians needed an elaborate cadre of user tools to highlight, explain and diagnose images for various types of medical providers and specialists.
AI Measurement
We hear so much about AI in the healthcare space it gets a little exhausting. But the truth is, it could not be more exciting, and for one simple reason: AI is putting a little breathing room back in the care providers day. The automated measurements and color coding included in Radiology Queue give technicians a jumpstart in their analysis, paves the way for a more responsive care cycle and the ability perform an accurate diagnosis in much less time.


Metric
Metric measurements were used to follow industry best practices for medical tools Zooming in and out to better provide the most accurate measurements and document these measurements by hand is still critical and not something that can be trusted to some form or machine learning; at least not yet.

Color coding
Why explain when a simple color can say it all? Adding a structure and mechanism for coding areas of concern and those presenting non-threatening or less concerning visuals was developed to allow for cursory reviews and a quick understanding of the overall health of the patient based on this particular scan. A series of information-specific labels were added that could then be transferred to a textual list for more detailed documentation and commentary needs.
A high sophisticated platform with countless user paths.
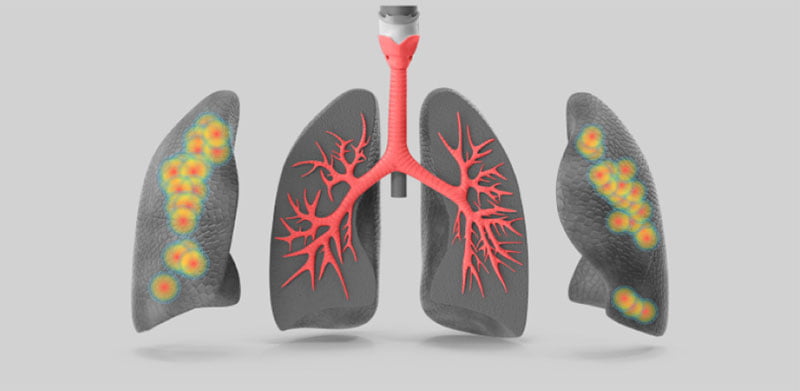
A series of 3-D graphics were created to give technicians an easy-to-use visual canvas to work from and to explain their analysis. Individual “hot spots” are highlighted and can be extracted/zoomed in on to analyze in the most excruciating detail possible.
Additional drill-down and clickable elements were designed to allow users to investigate and display organs separately and to view them from several angles.


Data Analysis
For radiology clients to better understand the amount of discovered abnormalities, we created this interactive calendar with visual indicators of the ebb and flow of discoveries they have made over time and to be able to compare from year to year. This not only helps with understanding the clinical discovery success rate but also gives technicians a baseline expectation for their daily work.
Designed by:
Art Direction
George Railean
Project management
Vladimir Bobu
Design
Marcel Sendrea
Lina Ghimp
Do you want to create something similar?
Get a free estimation for your project requirements and start it within 24 hours.

