Map Data Visualization Services

Map data visualization, or geospatial data visualization services, involve the use of maps to represent and display various types of data, making it easier to understand and analyze complex and unwieldy amounts of information. We often leverage geographic information systems (GIS), mapping software, such as MapBox or ArcGIS, and data visualization techniques to create interactive maps that provide meaningful insights.

Map Visualization Agency

Map designers are a special breed in the data visualization community. To create an interactive map that is both able to convey vast amounts of information, immediately intuitive for users in terms of what is possible and able to provide usable insights is the trifecta of map visualization teams. At Fuselab we design map data visualization for various industries, including retail, logistics, healthcare, real estate, environmental science, transportation, and urban planning.

Semirings & Heat Map

Our Map Visualization Design Process

To create a map visualization doesn’t happen in a vacuum, we have very specific process that begins with solid user research and requirements gathering. These foundational processes set the stage for a design process based on verifiable user inputs and agreed to goals.

User Research

User Research

  • Define the goals of the dashboard
  • Identify the target audiences
  • Develop specific personas
  • Begin creating use-cases
Requirements

Requirements

  • Identify the stakeholders
  • Prioritize the requirements
  • Document the requirements
  • Publish findings for design team
Technical Limitations

Technical Limitations

  • Data complexity
  • Database size
  • Real-time data updates
  • Data accuracy
Explorations & Data Visualization Experiments

Explorations & Data Visualization Experiments

  • Define the goal of the experiment
  • Begin wire framing process
  • Create the visualization
Test & Refine

Test & Refine

  • Evaluate the criteria for success
  • Execute the test
  • Refine and repeat

Types of Map
Visualizations

All of the different types of map design make for the most all-inclusive ways to present vast amounts of data efficiently and effective for multiple audiences.

How to know what types of digital maps to deploy for what audiences is entirely contingent on regular and repetitive user testing. As a rule, “what works today doesn’t mean it is the right choice tomorrow or a year from now. This space is not just constantly evolving, it is also constantly improving.

Heatmap icon
Heatmap

Heatmap data visualization is exactly what it sounds like, and even for those presented with this kind of map, it is immediately obvious the intent behind it. Heatmaps allow for simple and effective interaction, such as zooming in and out to display specific data layers.

Heatmap
Administrative Map

An administrative map usually involves some kind of real-time monitoring of data. In this case, the map to the left depicts the movements of an entire fleet of trucks, their trip times, profitability of each trip, average vehicles speed, and about a million other datapoints.

Administrative Map
Statistical Map

A statistical data visualization map is a visual summary of data according to user selected filters, such as region, time, and/or demographic. Understanding the buying habits of your target market is just one of many uses for this kind of map.

Statistical Map
Trajectory Map

A trajectory map is a type of map-based data visualization that is specifically designed to display the movement patterns of objects, individuals, and/or entities over a specific period of time. It is a powerful tool for understanding the spatial-temporal aspects of data, making it valuable in transportation, logistics, epidemiology, wildlife tracking, and a whole lot more!

Trajectory Map
Bubble Map

Every single bubble typically represents a specific location or geographical area in a bubble map, and the size of the bubble usually corresponds to a particular data value associated with that location. These maps are particularly useful for visualizing and comparing data across different regions or locations.

Bubble Map
Flow Map icon
Flow Map

Geovisualization techniques are most commonly found in the back of airline magazines, or possibly in large airport digital screens depicting arriving and departing flights from specific cities or airports. Additionally, these maps can be used with time-sensitive data to depict specific timing of flight trip progress.

Flow Map
Spikes & Heat Map icon
Spikes & Heat Map

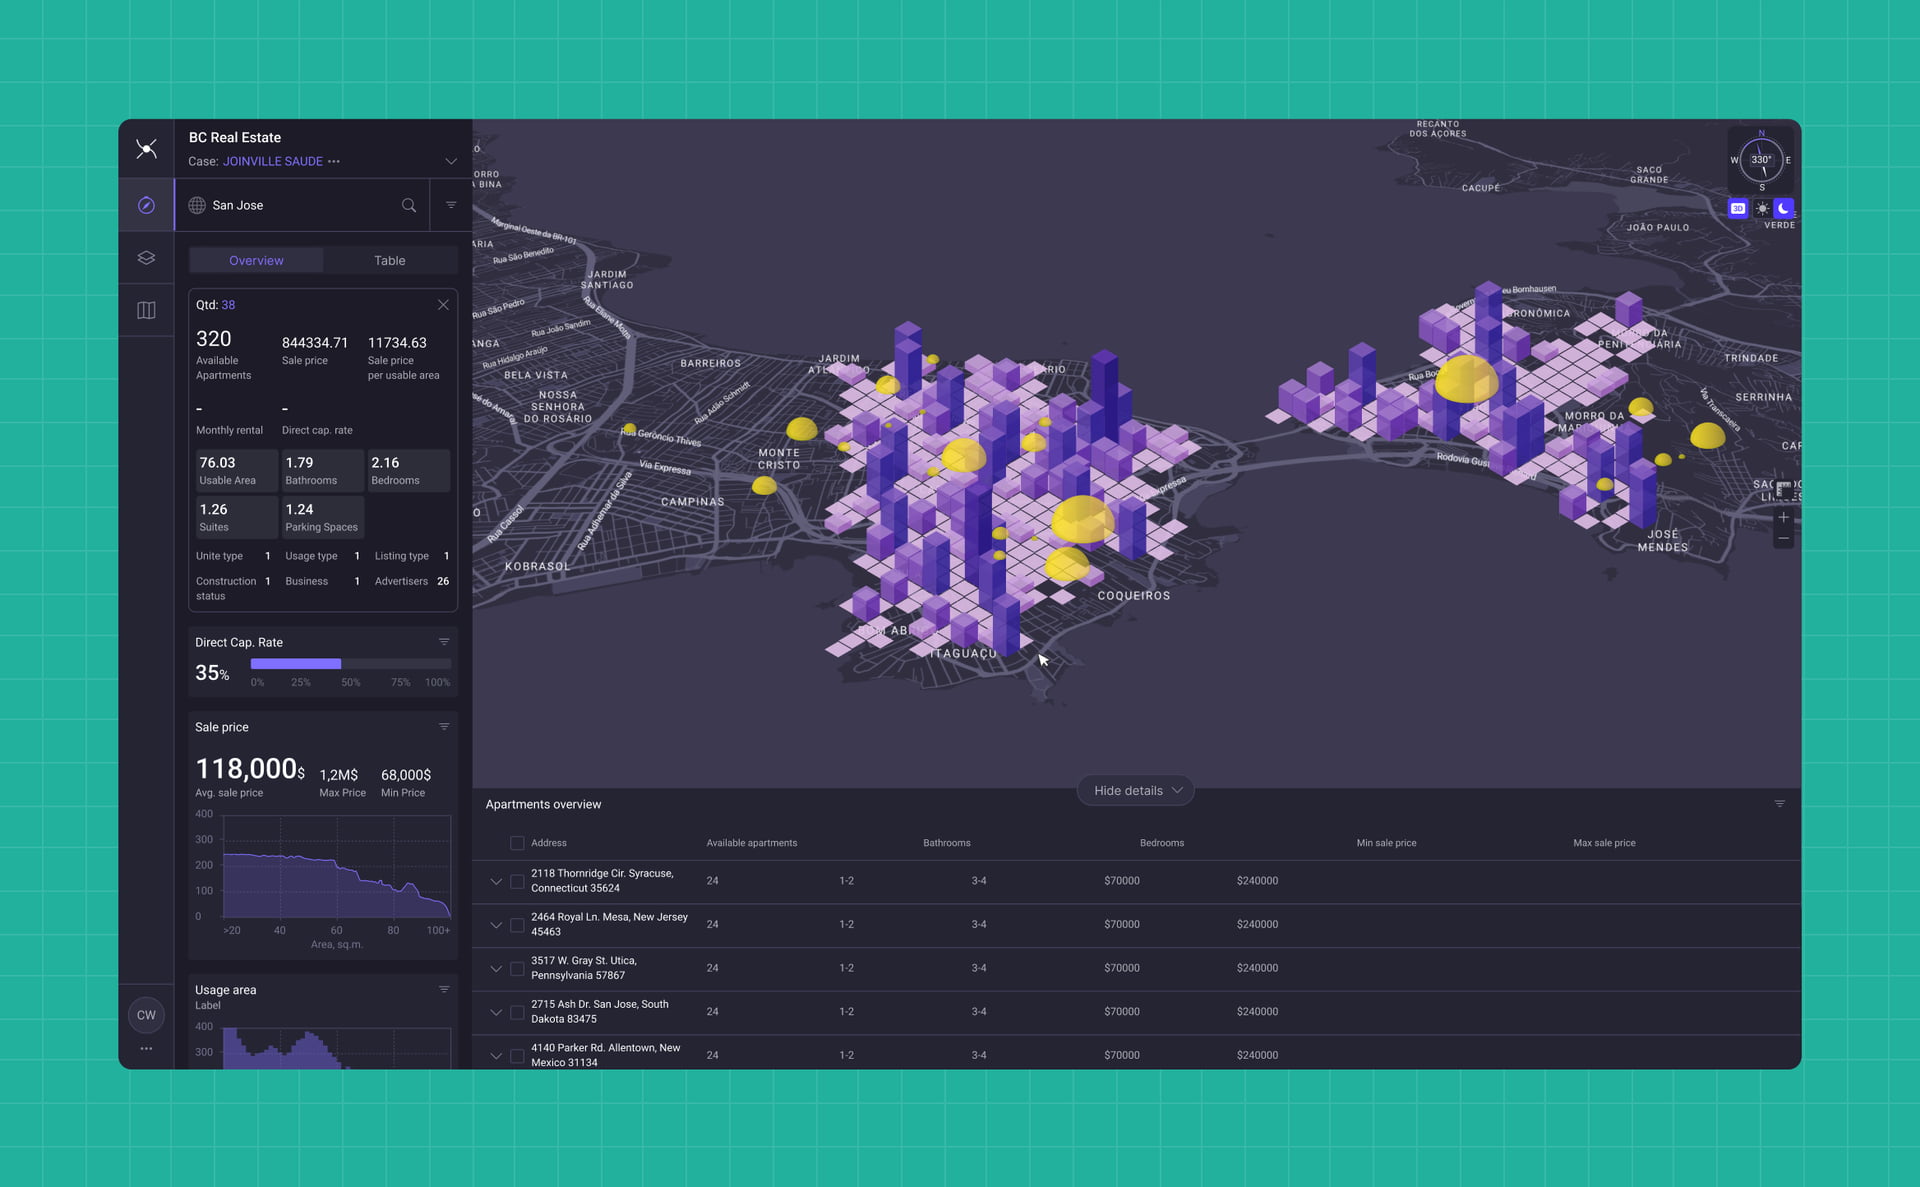
A spike-style heat map is a type of data visualization that represents data points as spikes, typically to show the density or distribution of a specific phenomenon that is specifically attributed to a geographic area. This visualization is useful for understanding spatial patterns and trends in data.

Spikes & Heat Map
Dynamic Interactive Map

A dynamic interactive map might be one of the most interesting and useful forms of data visualization. This map-based tool allows users to explore and interact with data in real-time or through user-driven interactions. These maps are designed to provide a highly engaging and informative experience by enabling users to manipulate and explore data visually and to continuously dig deeper into the experience.

Dynamic Interactive Map

Advantages
of Geospatial

Visualization

Geospatial map visualization offers a powerful tool for businesses and organizations to gain valuable insights from spatial data, facilitating informed location-based decisions.

Advantages of Geospatial Visualization Advantages
Advantages
Advantages

Why Are Maps Important in Data Visualization?

Map-based data visualization can be on the most powerful tools for communicating complex data-driven stories. They make it easier to convey information to a broad audience, whether it’s for educational purposes, news reporting, or policy advocacy.

In fields like business, public health, and disaster response, efficient resource allocation is critical. Maps help organizations allocate resources where they are needed most effectively.

Why Are Maps Important in Data Visualization
Scope
Scope

Interact
With the Map

Interactive map data visualization are often dynamic maps that use animation to show changes over time. This can be particularly useful for visualizing temporal data, such as the progression of a storm on a weather map or the movement of vehicles on a transportation map.

Multiple levels of data

Configuration

Configuration

Layering

Layering

Our Map Visualization
Services and Solutions

Map Dashboard Design MDD

Map Dashboard Design

Immerse yourself in an intuitive and visually appealing map dashboard that offers a tailored experience. Our expert designers craft interactive interfaces that guide you effortlessly through the world of spatial data. Get ready to explore and uncover the hidden gems within your information.

Interactive Map UI/UX Design IMD

Interactive Map UI/UX Design

Engage with your data like never before, and say goodbye to challenging navigation and hello to an interactive user experience like no other. Our map UI/UX designs bring your data to life, allowing you to seamlessly explore and interact with your visuals. Let the data tell its story and open new doors for understanding and informed decision-making.

GIS Design GIS

GIS Design

Our geographic information system design services go beyond simple mapping. We delve into the world of geographic data analysis and visualization. Uncover valuable patterns and relationships within your data, enabling you to make data-driven decisions that drive success.

Dynamic Map Layers DML

Dynamic Map Layers

Unveiling the richness of your data experience reveals the power of overlaying multiple datasets on a single GIS visualization map. Dynamic map layers reveal intricate relationships and patterns, providing a comprehensive understanding of your information. Unleash the potential of your data with this multi-dimensional approach.

2D & 3D Map Visualization 2D/3D

2D & 3D Map Visualization

Watch your data come to life through our exceptional 2D and 3D visualization services. Gain a deeper understanding of your information with seamless transitions between dimensions. Dive into the details and see your data from new perspectives.

Data Integration DI

Data Integration

Our data integration services seamlessly blend data from multiple sources, creating a unified view for analysis and visualization. Whether it's importing CSV files, spreadsheets, or databases, we ensure a smooth process. Get ready to explore the full potential of your data, all in one place.

Advanced Data Filtering ADF

Advanced Data Filtering

Our advanced data filtering capabilities allow you to refine your analysis and focus on the most relevant insights. Discover hidden gems within your data and gain a deeper understanding of your information.

Report Generation RG

Report Generation

Create visually compelling reports that combine maps, charts, graphs, and text to communicate your data-driven insights effectively. Tell a captivating story that resonates with your audience and drives informed decision-making. Let your reports become your secret weapon.

Geo Visualization
Examples

Geo visualization is also known as geospatial data visualization, and it refers to the use of maps or geographic representations to visually communicate and analyze data that is tied to specific geographic locations or regions on a map.

Automatize - Map Visualization
Blis - Map Visualization
Datamonitor - Map Visualization
DHCS - Map Visualization

Map Visualization Portfolio

Year
Industry / Project Services

Data Visualization Map
Design Examples

The amount of styles and menu options when it comes to data visualization maps the list of possibilities just keeps growing, which means our map data visualization agency needs to continuously seek out new ways to illustrate data for our clients.

Incorporating GIS mapping graphics along with client specific data can produce unexpected insights and a digital map experience that is as engaging as it is informative.

Data Visualization Map
Design Example

Map Layers

Below is small list of map layers types, not an exhaustive list, but these are some of the most popular and useful types of graphical layers that are used in map data visualizations.

Map Layers Slots

Slots

Slots is a commonly used visualization type for geospatial data map application design. Slots is a term used to represent a layer that is a combination of images associated with UV map (U represents the horizontal axis and V represents the vertical axis).

Heatmap

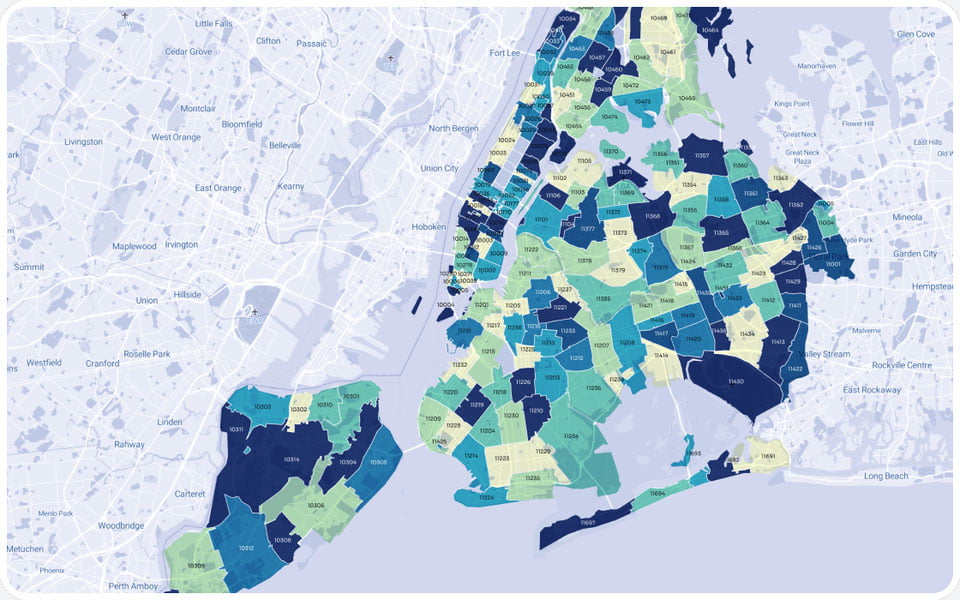
Sometimes you may hear the term choropleth map, which is just another way to say heat map, which is essentially the blending of colors to applied regions on a map to indicate the changes taking place according to a specific data type, several data types.

Map Layers Heatmap
Map Layers Dots

Dots

A dot map visualization creates clusters of dots to indicate specific data points or events on a geographical or spatial map. Typically, each dot symbolizes a single occurrence or unit of data, such as a specific number of people, events, or objects related to a particular location.

Spikes

A map data visualization company has a plethora of visual choices to choose from, and the choosing of each visual depends heavily on the type of data selected. It’s the combination of the data type and the graphic elements implemented determine the possibility of delivering a successful UX.

Map Layers Spikes
Map Layers Traffic

Traffic

Possibly the most recognizable form of map visualizations is highway and road traffic maps, often using simple red, yellow, and green to show the level of congestion and free flowing traffic across a particular region or network of roadways.

Taking Map App Design
to the Next Level

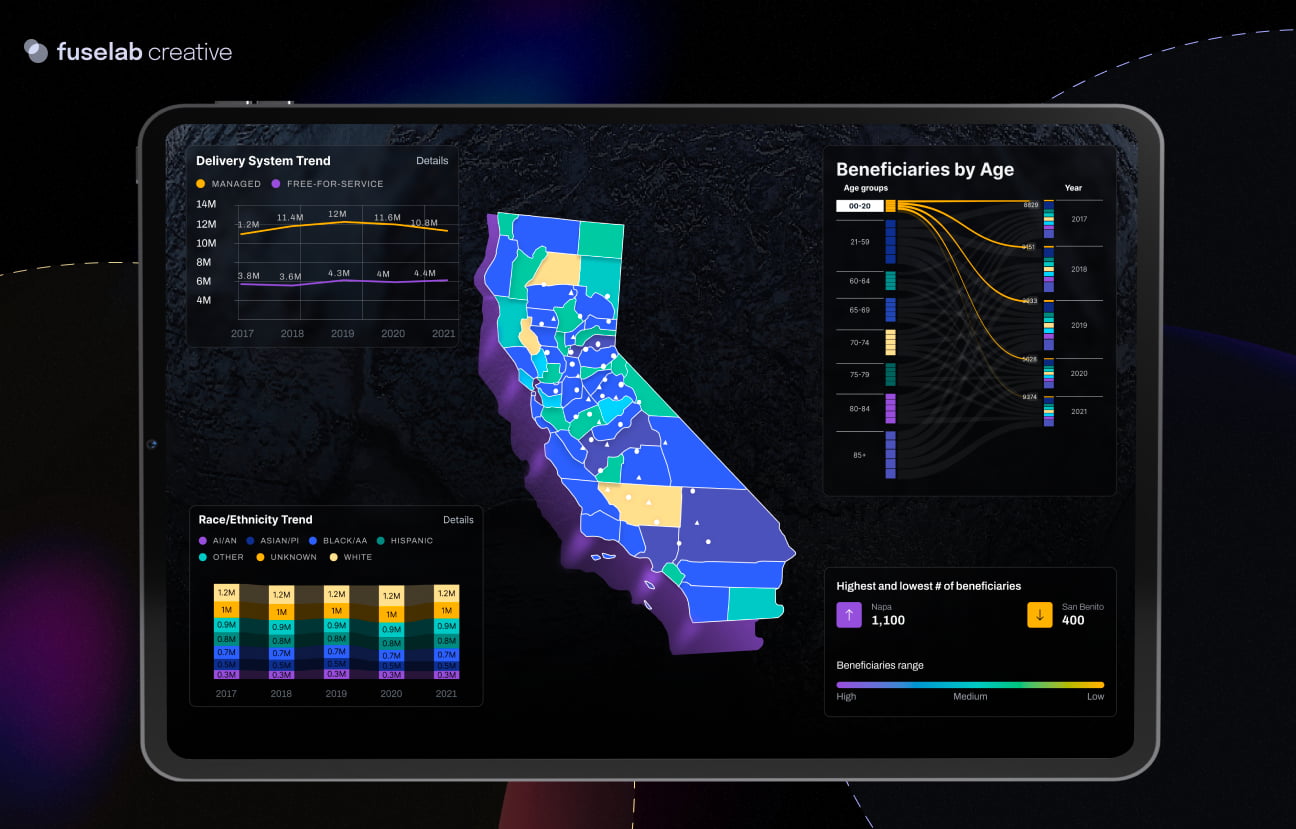
Fuselab Creative has been working with the State of California’s Health Care System to reimagine how to make use of their health care beneficiary data. We were required to use PowerBI (PBI) in our efforts, but were able to increase the level of sophistication of PBI by creating our own custom data visualization modules.

Taking Map App Design to the Next Level

Country Statistics

Comparing health-related data across the world allows for governments and large health organizations combat disease and epidemics, among countless other statistics that help protect the public health.

Country Statistics

Healthmonitor Data Dashboard

To create a map for a data dashboard also requires a sophisticated legend and data filtering system to allow users to customize what they are viewing and meet their particular goals.

Program On Government Oversight – Covid-19 spending tracker

Data map visualization work is a constantly evolving landscape, where designers like Fuselab Creative are pushing the boundaries to find new and more informative ways to create useful insights on behalf of its stakeholders regardless of industry or purpose.

Program On Government Oversight - Covid-19 spending tracker

Map Visualization Tools And Technologies We Use

The list below is constantly evolving, as we develop our own software, such as FuseDash, as well as adding and deleting our primary software suite we rely on to experiment with the most effective tools to create effective data visualizations.

Google Earth

Google Earth

Someka Heat Maps

Someka Heat Maps

Tableau

Tableau

OpenHeatMap

OpenHeatMap

InstantAtlas

InstantAtlas

Polymaps

Polymaps

Mapbox

Mapbox

ESRI

ESRI

Sisense

Sisense

FuseDash

FuseDash

Power BI

Power BI

Custom App

Custom App

Industries We Love to Design
Interactive Maps For

Healthcare

Healthcare applications and disease map data visualization projects have now become more than 50% of our current project workload. Working on behalf of better health and better decision making for health providers could not be more inspirational to all of us at Fuselab.

Transportation and Logistics

Logistics and telematics companies build platforms to move people and goods from one place to another. However, to properly build these platforms, design agencies like Fuselab must acutely understand how a routing map data visualization is used by stakeholders to become more efficient, increase profit, and the list goes on and on.

Travel

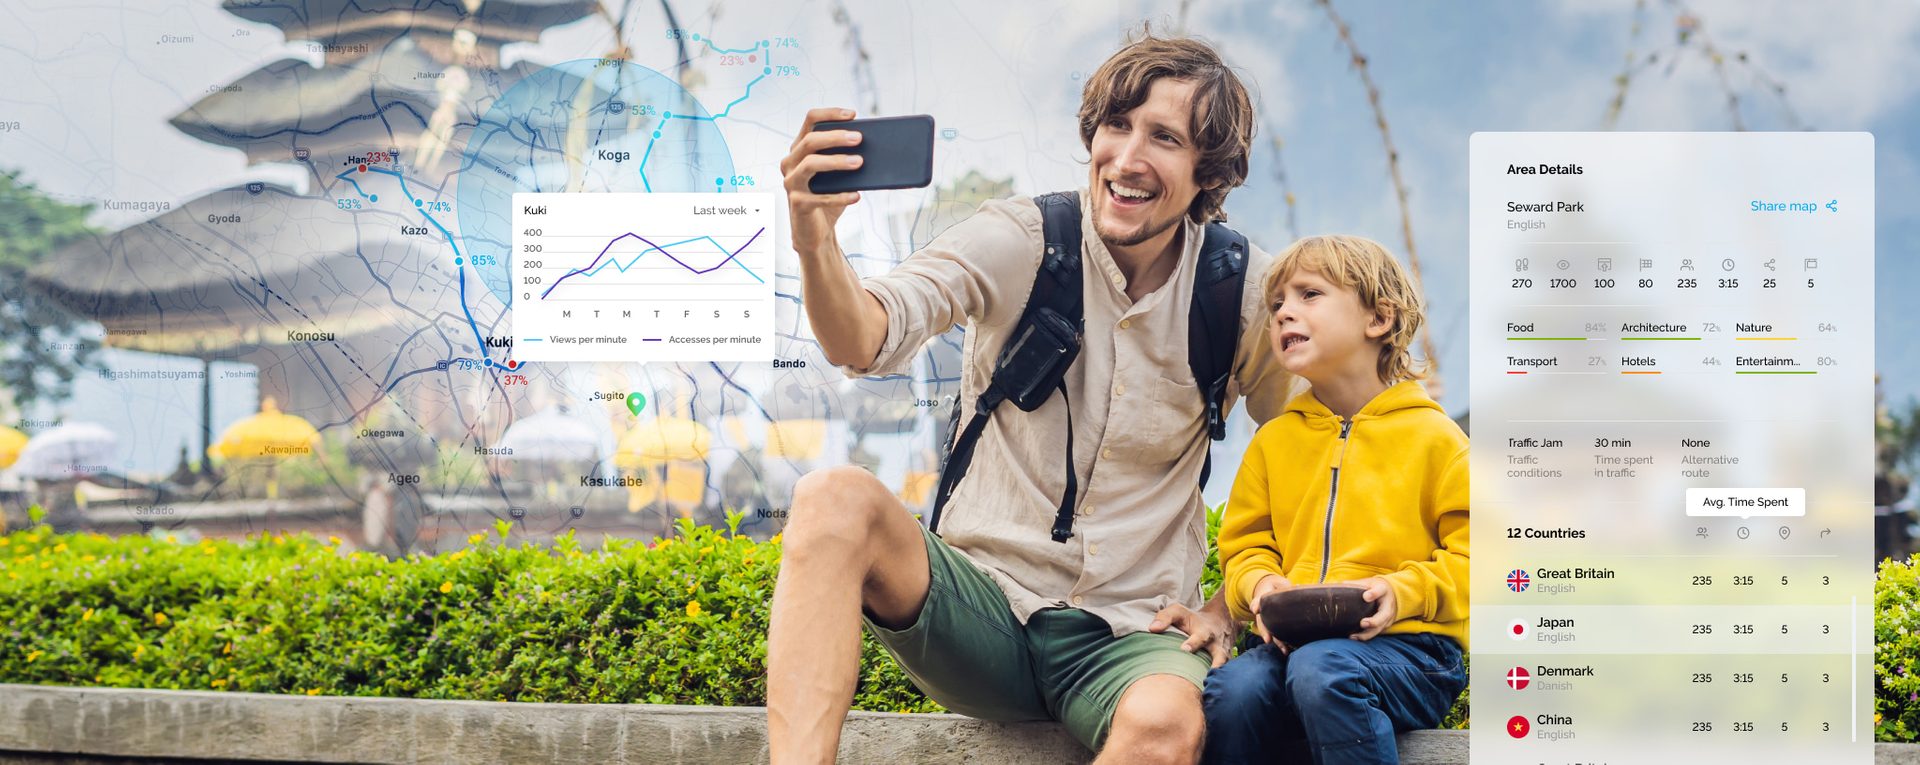
Travel map app UI design is focuses heavily on mobile and tablet environments, as the expectations from users is constantly growing, including access to real-time traffic and public transportation data along with interesting tourist-related data. The UI needs to be 100% intuitive regardless of the users technical savviness or type of device being used.

Government and Non-Profit

Among the many critical services provided by city and county governments is the need to devise sophisticated plans to manage the fallout from natural disasters. A data visualization flood map can make the difference between a city brought to a halt or a city that is able to rise above the impact of a major flood.

Real Estate
Real Estate

Understanding the growth of communities and urban sprawl can best be depicted using data map visualization techniques. Using these maps and the corresponding historical data also provides a way to develop predictive analytics data to help circumvent future challenges and plan for the eventual changes taking place in particular regions.

Metaverse
Metaverse

Map data visualization can play a crucial role in helping users navigate the vast virtual reality geospatial worlds of the Metaverse. Just as maps are essential for finding your way in the physical world, interactive maps could guide users through virtual spaces, showing real-time locations, landmarks, and routes to their destinations.

Contact Us

Fill out the form!

    Read Our Blogs

    We are arriving at numerous inflection points in the world of data visualization and map data visualization. Here are just few of our blogs on the subject and some interesting case studies to ponder.

    Interactive map app design is evolving every day, as huge behemoths like Google experiment with new ways to guide people around this complex world of our via biking, walking, public transport, or automobile. The good news is that Fuselab has extensive experience building map visualizations for all of these areas and many more.
    View all articles