(edited)

Data Visualization Services

Good data visualization tells a story without the need for formal explanations. It is a nexus point where design, science, and communication exist to inform people in the language of the future.

Data Visualization Design Agency

As one of the best data visualization agencies in the USA, we now have over a decade of experience creating data visualization presentations, applications, and digital tools. To remain competitive, any organization that seeks to influence the thinking, actions, and engagement of its users must employ a team of data viz designers to present their data in a meaningful and intuitive fashion. This is now how successful businesses learn and make better decisions in the future.

Contact Us

Fill out the form!

    Data Visualization
    Process

    Our process of data visualization as a service follows a distinct flow to deliver the highest data visualization design and development impact.

    Discovery

    Discovery

    – What kind of data is there?

    – What does the data show?

    – What can we do with the data?

    – What is the value in the data?

    – Who is the target audience(s)?

    Data Manipulation

    Data Manipulation

    – User Research

    – Personas

    – User Behaviors

    – Competitor Analysis

    – Data Analysis

    Design Formats/Apps

    Design Formats/Apps

    – PowerBI vs. Tableau

    – Custom Python

    – Traditional graphic design

    – JavaScript/Animations

    Visuals

    Visuals

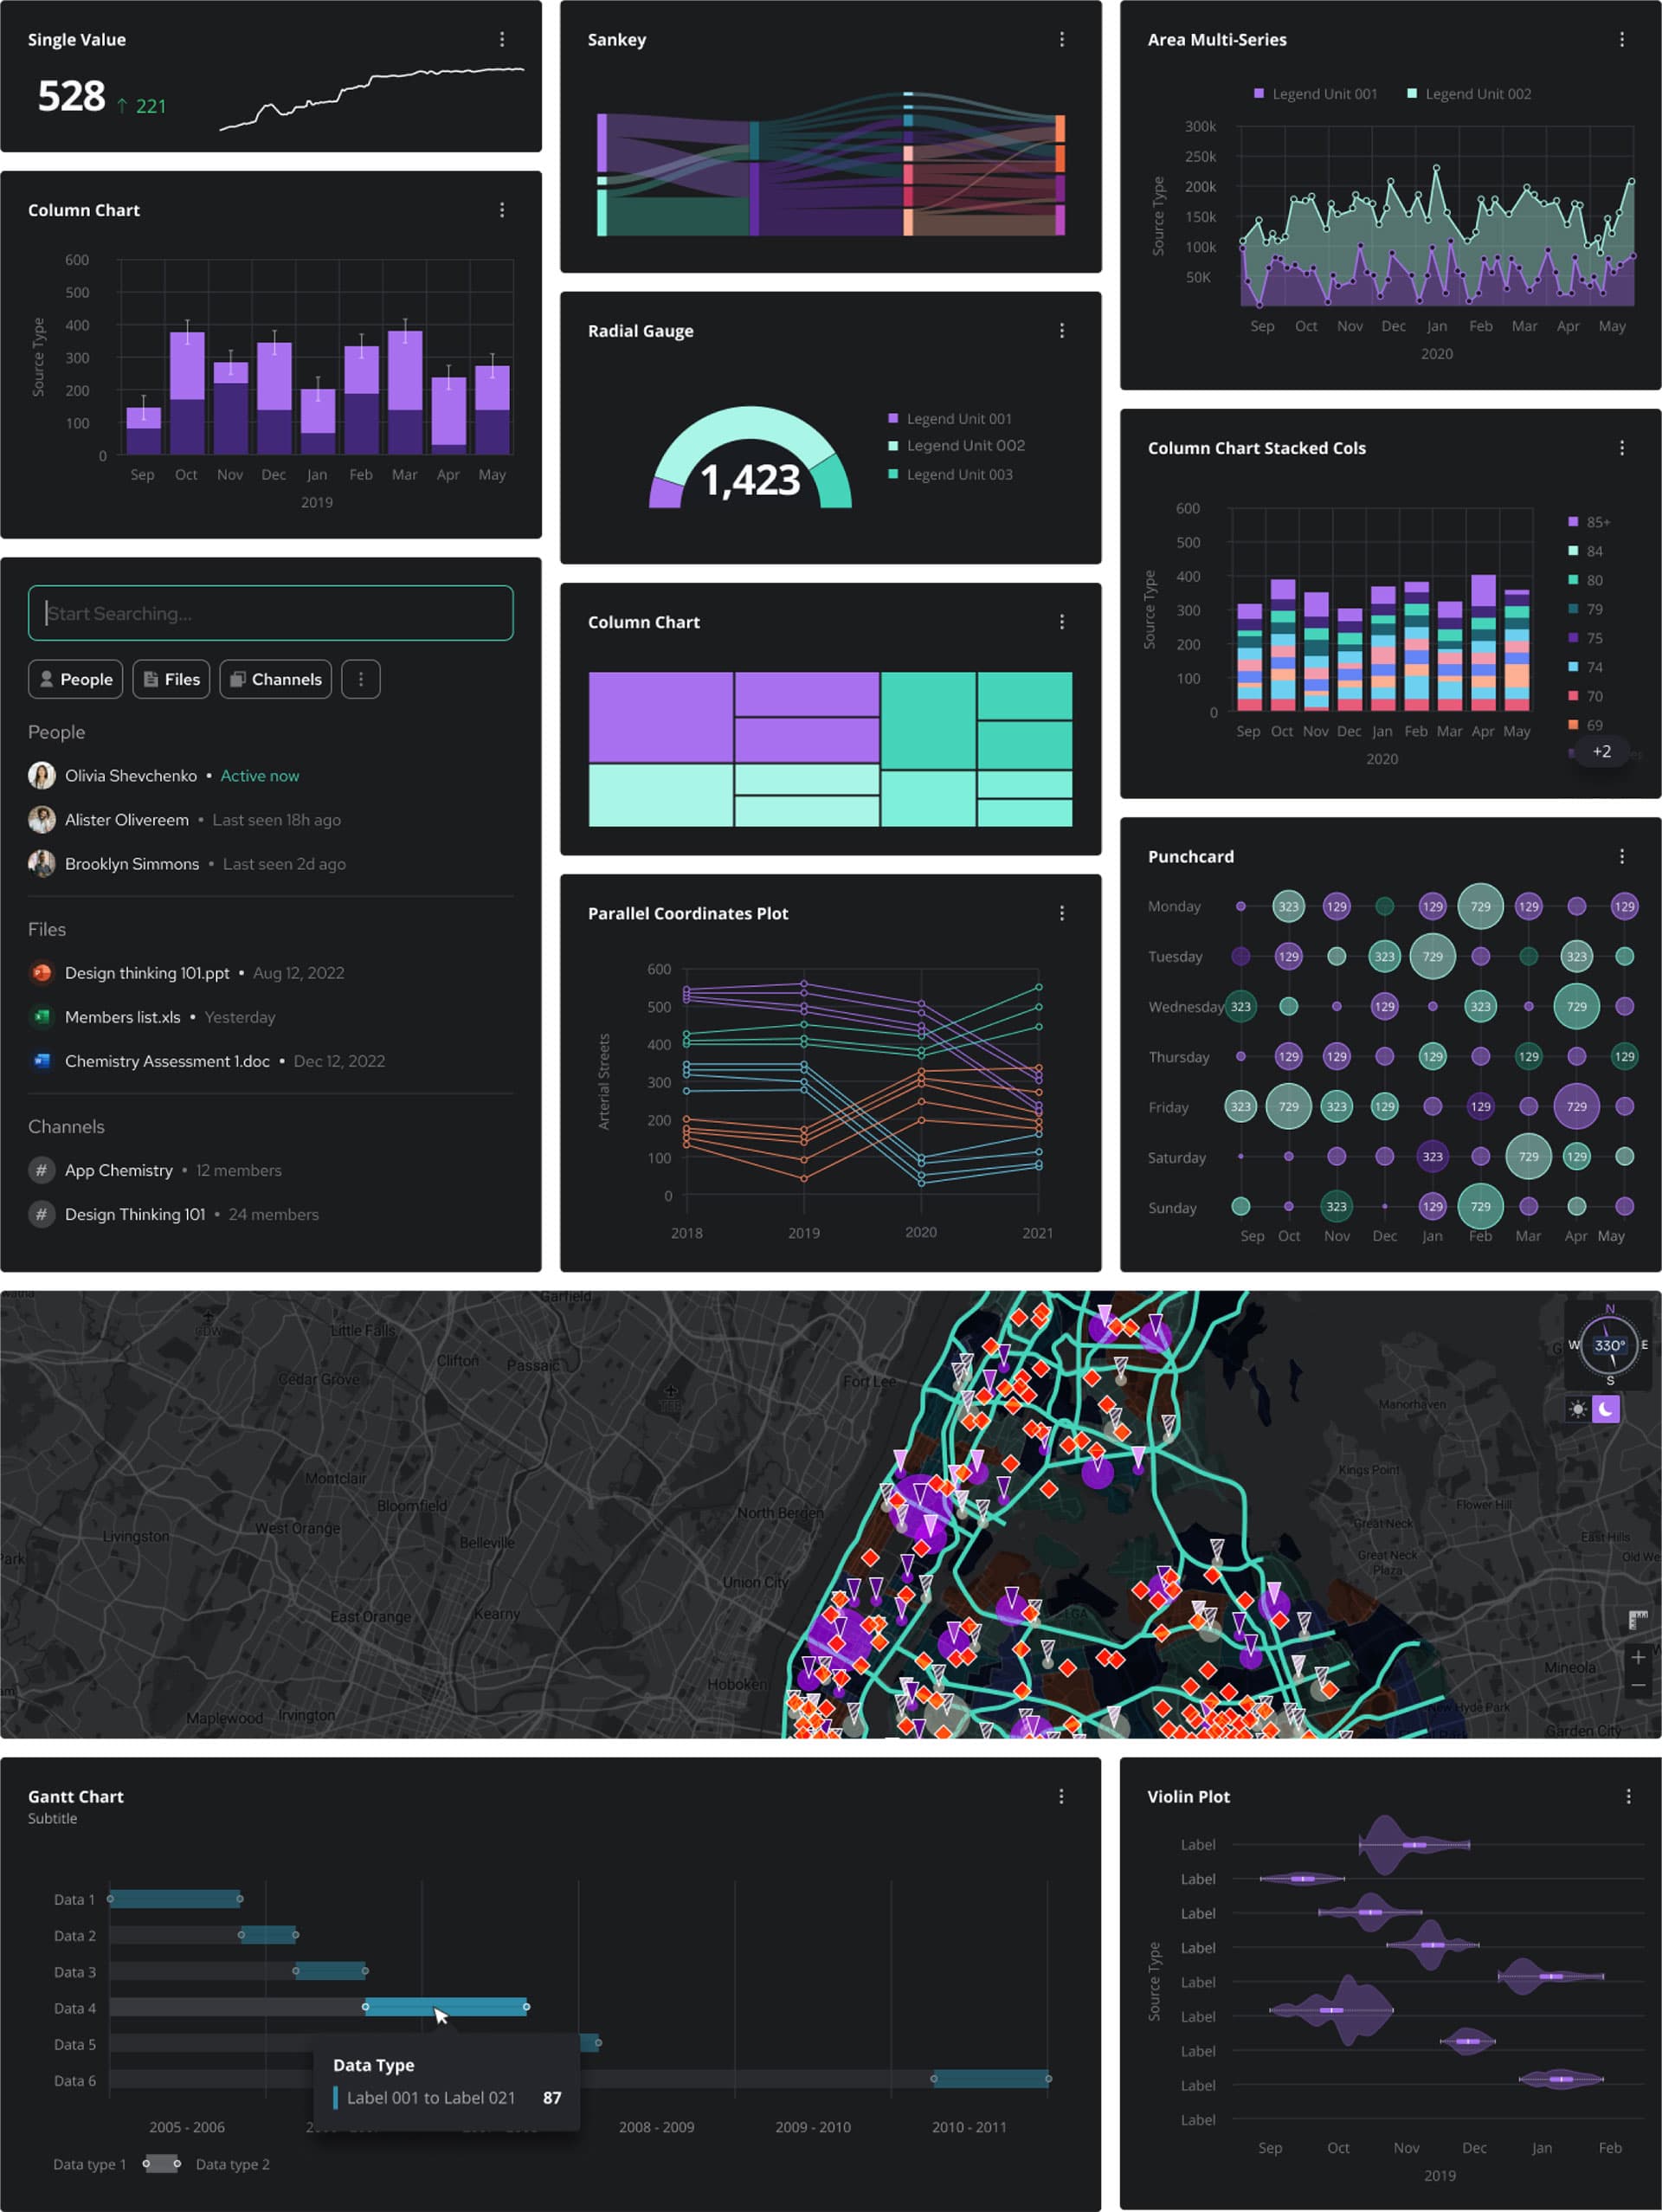
    – Bubble Cloud

    – Heat Map

    – Histograms

    – Scatter Plot (2D or 3D)

    – Sankey Chart

    – Infographics

    Testing

    Testing

    – Customization

    – Comparison Analysis

    – Modeling Options

    – Finding Outliers

    – A/B Testing

    – Heuristic Testing

    Data Tells a Story

    Data Tells a Story

    – Create data sequencing

    – Develop report generator

    – Create ability for KPI tracking

    – Allow for user customization

    Our Data Visualization
    Design Services Reel

    We offer some of the best data visualization services in the USA, see portfolio reel below.

    Research

    and Analysis

    Heatmapping as a starting point

    Often times many types of demographic data has to do with a particular region in the world, and users want to understand this data in relation to similar vicinities around it. This can be true for countries on a world map, states on a country map, or even neighborhoods. As a result, heat-mapping is often a great place to start to set the stage for deeper dives into particular regions and demographics.

    Data viz map

    Taking data to
    the next level

    The ultimate stage for modern data visualization is an interactive dashboard. Unlike so many visualizations we see on the web or in periodicals, the dashboard allows for user customization, data-driven insights, and ability to incorporate relational data within a functional tool that paves the way for ongoing knowledge transfer.

    Taking data to the next level
    Datamonitor Healthcare - Data Visualization
    Earthquake Prediction - Data Visualization
    Covid-19 POGO Tracker - Data Viz
    Blis Advertising - Data Visualization

    Data Viz Examples

    Our Design Examples

    Data Visualization UI/UX Design

    UX/UI design for a data visualization products is huge part of what we do every day now. Our approach to data visualization services begins with agreeing to a simple set of project and business goals, which sets the tone for the entire project.
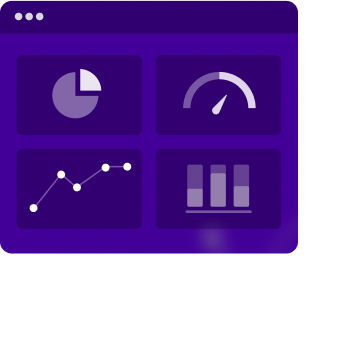
    Data Visualization UI/UX Design

    Data Visualization Dashboard Design

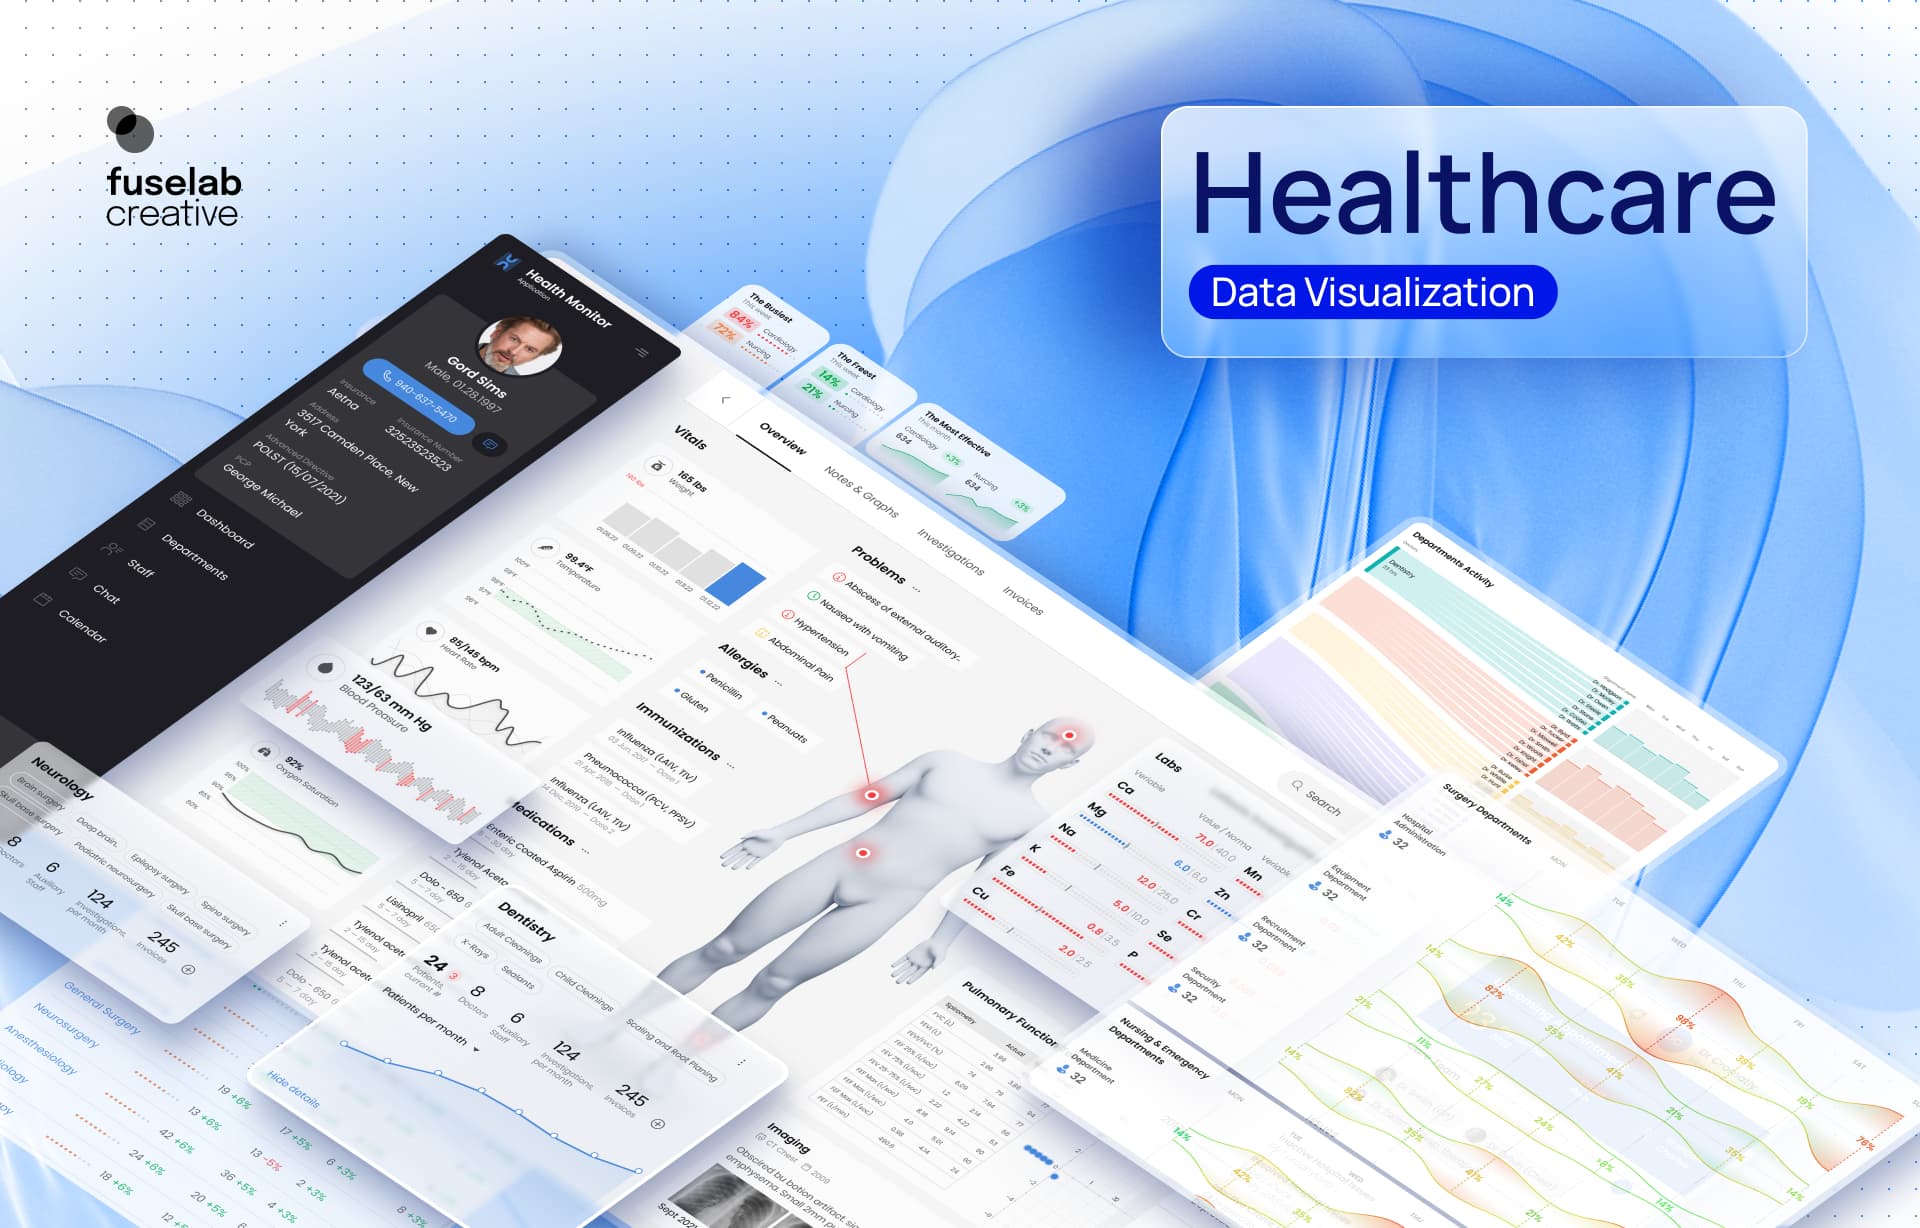
    Creating data visualization dashboards is how we have become one of the top data visualization agencies in the USA. This is particularly true of our work with healthcare application development and data visualization, which serves up patient data for medical providers to help deliver better health outcomes.
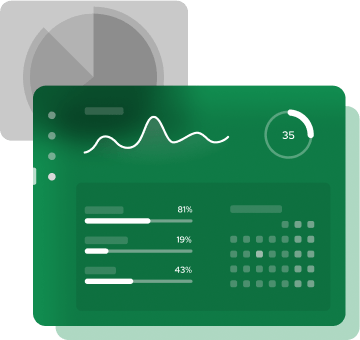
    Data Visualization Dashboard Design

    Business Data Visualization

    Business intelligence data visualization has become a critical service for the most successful businesses, both big and small. Whether you are need data visualization for business analytics and reports or are launching a new digital product, you will need data analytics design services to understand the ebb and flow of your market and to gain the required knowledge needed to stay competitive.

    Business Data Visualization

    Custom Data Visualization

    Creating custom data visualizations is not as elaborate as it sounds, it’s really about creating filtering and tabular functional options that are able to manipulate data in real-time to help organizations make better and more informed decisions and planning-based predictive analytics.
    Custom Data Visualization

    Data Visualization Portfolio

    Year
    Industry / Project Services

    Related Services and Solutions

    View all services

    Data Visualization for POGO Covid-19 Government Spending Tracker

    Data Visualization Tools
    And Technologies We Use

    Data visualization firms need a savvy group of experienced designers that are well versed in an ever growing list of technologies.

    Tableau

    Tableau

    Three.js

    Three.js

    Chartkick

    Chartkick

    Recharts

    Recharts

    Vue.js

    Vue.js

    ApexCharts

    ApexCharts

    D3.js

    D3.js

    V Charts

    V Charts

    Power BI

    Power BI

    React-Vis

    React-Vis

    WebDataRocks

    WebDataRocks

    FlexMonster

    FlexMonster

    Industries We Create
    Data Visualizations For

    Healthcare

    Healthcare apps require data visualizations to be effective, as most care providers don’t have the time to read pages of information and need high level patient data that is easily consumable in minutes.

    Travel

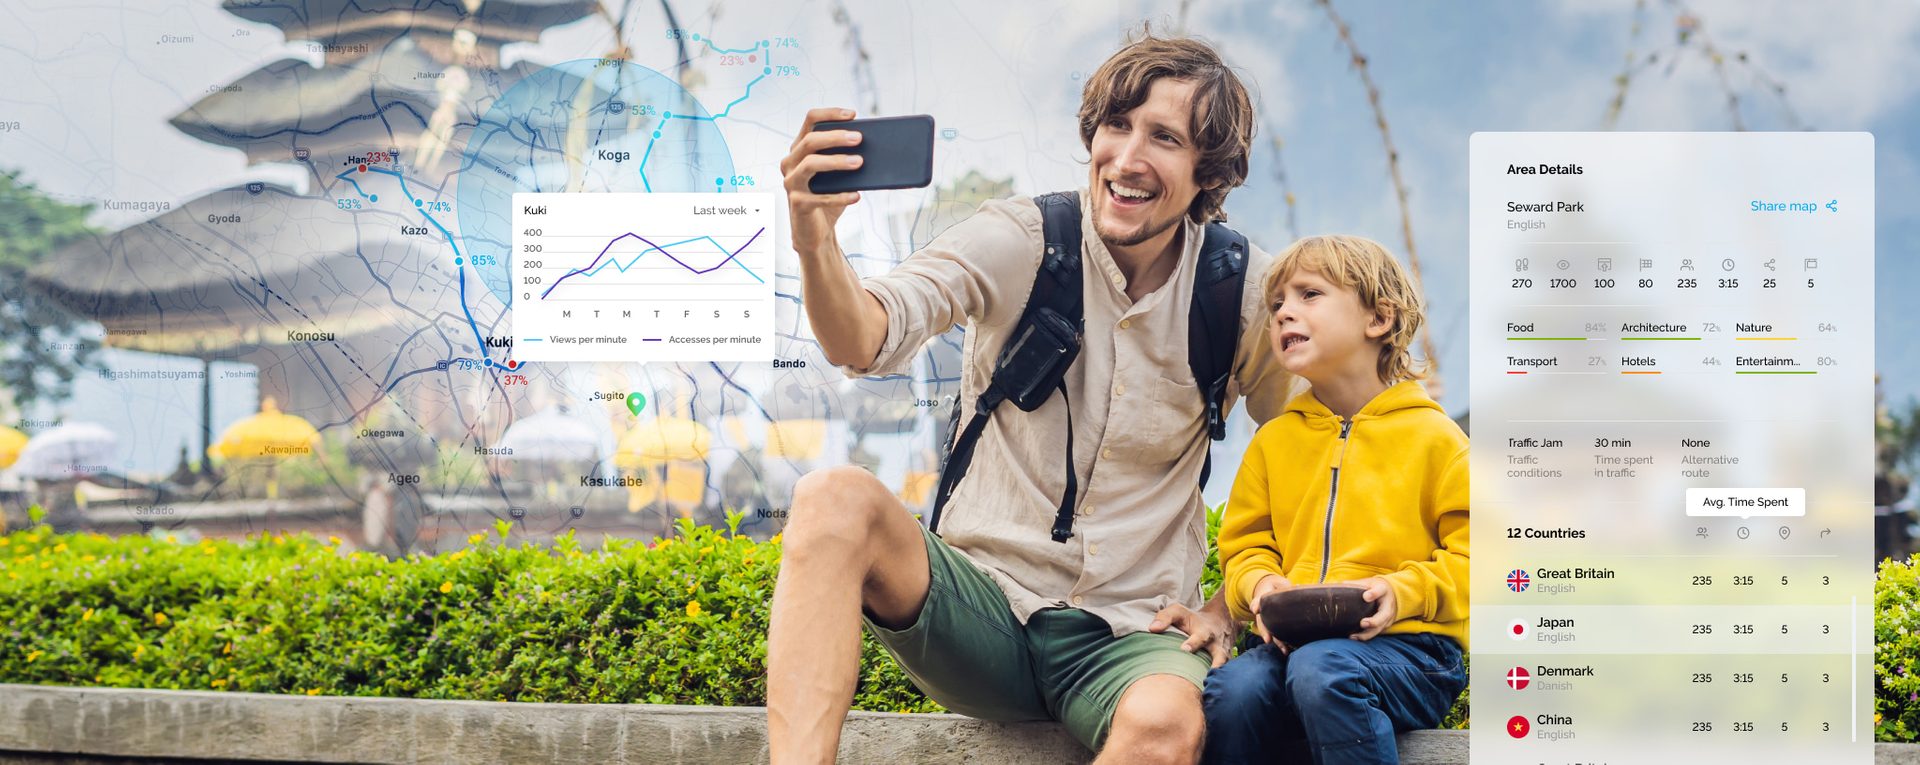
    Mobile travel applications rely on data visualization design to help travelers make reservations, choose restaurants and guide them from point A to point B.

    Transportation and Logistics

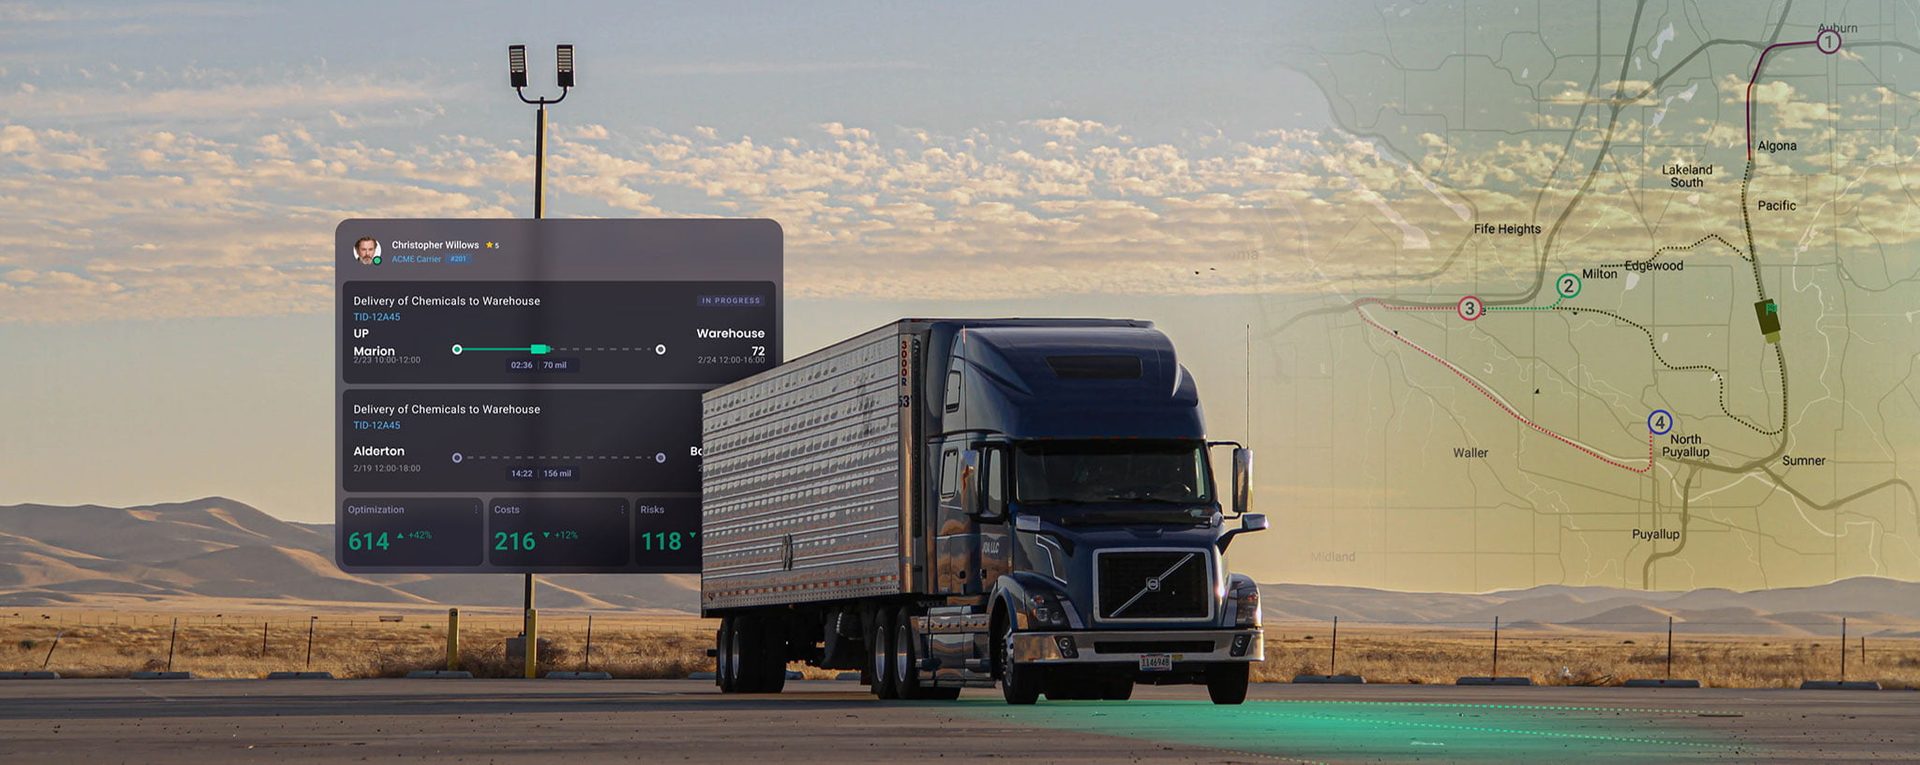
    Fuselab Creative has become a leading UI/UX data visualization company for the transportation and telematics industries, helping truck fleet managers and transportation systems run efficiently via big data visualization services.

    Real Estate
    Real Estate

    Real estate marketing and sales relies heavily on data to determine hot markets and our digital data visualization services team has helped several local and state agencies take decades of data and come up with creative data viz based products.

    AI and ML

    Artificial intelligence and machine learning are 100% reliant to data, and in most cases the end product involves big data visualization services to be truly effective.

    Ecommerce and Retail

    If you are managing a retail or ecommerce sales company of any kind getting daily data visualization reports can have an incredibly positive impact.

    Read Our Blogs

    Data Visualization Design Blogs

    Learn more about why we have focused so much time on creating breakthrough tools and products that rely on cutting- edge UI/UX data visualization design and development. Data visualization is well on its way to becoming a kind of foreign language that our UI/UX design team now speaks fluently!
    View all articles