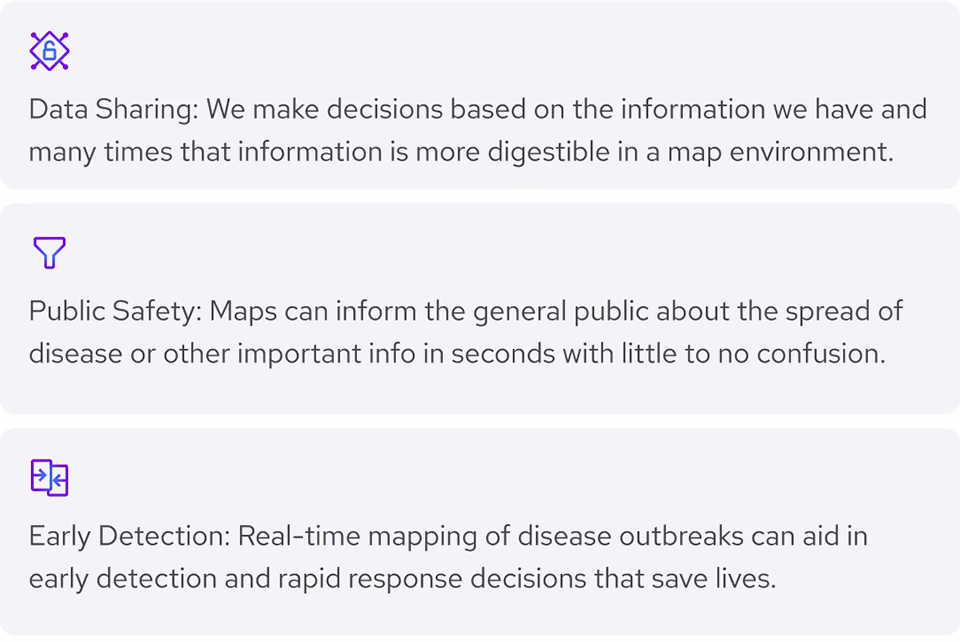
In terms of communicating community exposure rates of some kind that can impact public health, maps, combined with expert data visualization graphics, are arguably the premiere communications vehicle we have. As most members of any public health department will tell you, graphics, and maps specifically have the communicative muscle to get a message out to millions of people in seconds. There’s really no other tool that packs the same punch.
Map Visualization Agency
Map designers are data fanatics that happen to also inhabit and thrive in the graphic design and communications fields as well. The holy grail of this discipline is our ability to aid and improve the dissemination of information the can have a positive impact on people’s lives while also improving the public health. Anyone that watched the news coverage of the Covid-19 pandemic became quite familiar with the term and associated graphic of how we all must work to “flatten the curve.” However, it was the regional map graphics that hit home for all us, and actually had a real-life impact on our travels outside our homes how we parented our children. Fuselab Creative is proud of our contribution public health through map visualization, and hope to keep increasing our level of impact for decades to come.

Health Literacy
Critical Data
& Our Current
Dilemma
Health literacy, namely, “the ability to access, comprehend, evaluate, and communicate information as a way to promote, maintain and improve health in a variety of settings across the life-course” is generally low in the general population. It has been estimated that 88% of American adults (U.S. Department of Health and Human Services, Office of Disease Prevention and Health Promotion. 2010) have low health literacy. This is exactly user-friendly tools like maps is critical for public health communications and effective management practices.

Where we are now:
Currently, as a society, we are facing all kinds of potential public health issues, such as asthma in low income and industrial sectors of the country. How we address issues like this is a point of contention for the medical community, government officials, scientists, and moms and dads everywhere. However most people agree that the more clear and accessible that the public information can be the more effective we are at mitigating the risks.

Some Examples of Public Health Risks:
- Air and water pollution
- Contagious disease or virus
- Noise
- Radiation

Some Examples of Mitigation Methods
- Area restrictions (eg. school closures)
- Mask wearing
- Vaccination
- Filtration systems
Map Visualizations
That Help Explain
Public Health
Demographic Data
There are a seemingly endless amounts of map visuals styles to choose from, and in the end, it comes down to two things: 1. The type of data to be displayed, and 2. What strategy is able to convey the data in the most accessible and intuitive way.
A lot has been and continues to be written about human-centered design, and we at Fuselab would like to suggest that when it comes to communicating public health data, map visualizations are our most powerful human-centered design approach we have in our tool chest.
Demographics by Location
Heatmap data visualization is exactly what it sounds like, and even for those presented with this kind of map, it is immediately obvious the intent behind it. Heatmaps allow for simple and effective interaction, such as zooming in and out to display specific data layers.

County or Regional Comparison Maps
If a state or country is attempting to better understand their population, in the pursuit of understanding those with the greatest needs, an interactive map can quickly show the hot spots and help users understand the actual numbers with interactive hovers and engaging companion graphics.

Chronology Map
Let’s say we are interested in seeing the progression of a health condition or disease over time. We may then want to deploy the use of a map in combination with a “visual player” to see how the changes in the condition we are tracking has or has not changed over a specific period of time.
Trend Map
Similar in approach to the chronology map above, trend-based maps use visual players along with heatmaps, and multiple layers of visual graphical indicators to help users understand specific trends that are taking place across a specific region.

How Data Visualization Maps Support
Public Health Agencies
Data visualization maps play a crucial role in helping public health departments in multiple ways, and probably some we haven’t even thought of yet. This tool helps us understand, analyze, and communicate public health data, ultimately improving decision-making and response strategies for the general public practically every day.


How Map Visualization Helps Make Decisions?
Public health departments can use historical data and trends on maps to plan for long-term health interventions and to decide what infrastructure improvements to fund first, or what areas are in the most need of repair. This includes building hospitals, clinics, and infrastructure in areas with growing populations that may be drastically underserved.

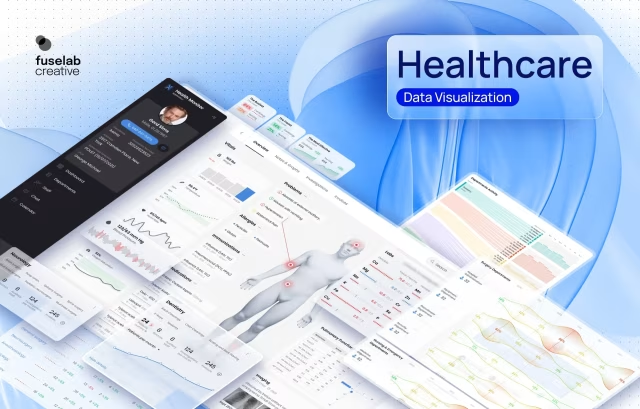
Our Healthcare Data Visualization
Key Process Steps

User Research
- Define the client goals
- Identify the target audience (personas)
- Define the persona goals
- Define user stories based on persona goals

Requirements Documentation
- Identify stakeholders and stakeholders expectations
- Prioritize the functional requirements before considering design approach or style
- Define the business or agency requirements
- Translate the requirements into initial design sprints

UX Interviews
- Conduct in-person interviews if possible
- Conduct remote interviews via screen share
- Conduct group interviews of those with shared goals
- Allow others to share views via online surveys

Explorations & Map Data Visualization Experiments
- Define the goal of each individual experiment and the provide multiple visual options
- Select experiments that receive the most positive feedback and make additional refinements based on comments received
- Build clickable prototype for early user testing

Key Map Design Elements to Consider
- Color scheme
- Legend
- Labels
- Visual Hierarchy
- Simplification Strategy
- Interactivity

Testing & Iteration
- Testing your for effective data visualizations on a map with representative users or stakeholders requires an in depth experience as to what kind of feedback will actually be helpful, and ensure that the map conveys the intended message and is easy to understand and use.
Map Viz for Public
Healthcare Portfolio


Hot Spots
Tracking Outbreaks
The amount of styles and menu options when it comes to data visualization maps the list of possibilities just keeps growing, which means our map data visualization agency needs to continuously seek out new ways to illustrate data for our clients.
Incorporating GIS mapping graphics along with client specific data can produce unexpected insights and a digital map experience that is as engaging as it is informative.
Public Health
& Dashboard Design
As we have been discussing in all of the previous sections of this page, data visualization mapping is an irreplaceable tool for communicating public health information. However, with these maps are paired with strategic data viz blocks and graphs in an interactive dashboard, the communications power is exponentially boosted!

Map Visualization Tools And Technologies We Use
The list of data visualization tools we use to produce different types of maps with unique and informative layers continues to grow all the time. The technologies listed below are just some of the technologies we are working with now.
Google Earth
Someka Heat Maps
Tableau
OpenHeatMap
InstantAtlas
Polymaps
Mapbox
ESRI
Sisense
FuseDash
Power BI
Custom App
Contact Us
Fill out the form!
Read Our Blogs
We are arriving at numerous inflection points in the world of data visualization and map data visualization. Here are just few of our blogs on the subject and some interesting case studies to ponder.