Professional dashboard design vs. amateur work (2026)
A professional dashboard is a data interface whose content is decided before any chart is drawn, by choosing which data earns a place on the screen, who the view serves, and the one decision it exists to support. The visible design is the final layer, not the foundation, which is why an amateur dashboard that tries to show everything fails, even when every chart is polished.
After nearly a decade of building these interfaces, we have shipped everything from a Fortune 500 fintech index to a frontline healthcare product, an energy grid monitor, and an aviation finance platform pricing aircraft worth tens of millions. They look nothing alike, yet the work starts the same way. Name the one decision the screen has to support, then keep everything unrelated off it.
What separates a professional dashboard from amateur work
A professional dashboard is separated from an amateur one by editing, not decoration. It answers a specific decision for a specific reader and pushes everything else a layer deeper, while the amateur version crowds the first screen with every metric a team can think of. Clarity comes from what gets left off.
Long before anyone picks a chart type or a color, someone has to decide what belongs on the screen at all. When a project stalls on whether a button should be square or round, that is usually a sign the harder questions got skipped. Those questions are about people and decisions, not pixels, and they are where good dashboard design actually happens.
The questions that matter come first. Who opens this screen, and how often? What are they trying to decide when they do so, and do they already know the context, or does the viewer have to supply it? Design that answers those honestly ends up looking very different from a design built around whatever data happened to be available.
A car dashboard makes the principle obvious, and is an example we use in meetings all the time. While you drive, you see speed and fuel, not tire-pressure history, service records, and every GPS setting at once. Someone decided what deserves your attention at seventy miles an hour and what can wait until you park. The information you need most is visible at a glance, and everything else stays one deliberate step away.
This is the exact problem we worked through on the Fiserv Small Business Index. The hard part was never drawing attractive charts. It was making dense economic data legible to policymakers, economists, investors, and small-business owners, each of whom arrived with a different question. The answer was a hierarchy: a few signals visible at a glance, and the rest reachable without competing for attention.

Built to be used, not just looked at
A professional dashboard has to do two jobs at once: show information clearly and structure it so a busy reader can act on it in seconds. That combination is what makes the work genuinely hard. Most screens manage one or the other, rarely both, and the gap shows the moment real users sit down under time pressure and need an answer now.
In practice, that hierarchy shows up in a few patterns: a fixed strip of three to five metrics, secondary numbers within a details toggle, drill-downs that open on a chart click rather than in a separate menu, and saved views so that a finance lead and an operations lead see different defaults. None of it is exotic. The judgment about which metrics earn the top strip is where the experience lives.
Every chart, color, and alert competes for attention, and each addition raises the effort required to read the screen. Nielsen Norman Group’s research on dashboards makes the same case from a perceptual perspective: people read length and position almost instantly, so plain bar and line charts load faster than pie charts, gauges, or radar plots. Grouping related data and reusing consistent patterns is how you keep that effort down.
The Aircraft Bluebook valuation platform is a clear case. It prices general-aviation aircraft going back more than a century, and a single tail number’s value can move on paint scheme, winglets, avionics, and maintenance history stacked together. Showing all of it at once would bury the buyer, so the interface leads with what brokers need first and lets the rest open through filters. The complexity was organized, not deleted.
Saying no is the hardest part of the job. Every team wants its own metric on the front screen, and nobody likes leaving data behind, but more numbers do not buy more certainty. Faced with fifteen charts and twenty KPIs, people stop trusting the screen and drift back to the spreadsheet they already understand. A dashboard nobody opens twice is not finished. It is abandoned.

Clean enough to read in five seconds
A professional dashboard is clean enough to read in about five seconds when a first-time viewer can name the one thing it is telling them without scanning the whole layout. That is the real test of hierarchy. If someone has to hunt across the screen to work out what matters, the design has already failed, no matter how polished the individual charts happen to look.
People do not open a dashboard to admire it. They arrive with a working question, usually some version of what happened, why it happened, and what to do next, whether they are a sales lead watching revenue or an operations manager watching service levels. They want that answer fast, and a cluttered screen makes them dig for it.
Cleaning up does not mean stripping data out. It means layering it. Nielsen Norman Group’s guidance on progressive disclosure captures the approach: show the few things that matter first, reveal the rest on request, and keep the levels shallow, because designs that bury information three clicks deep lose people. The first screen answers the biggest question, and filters and secondary views hold the follow-ups.
The EffiTrack energy-monitoring platform runs on datasets spanning global, regional, and single-building consumption. The tempting move is one dense overview with everything on it. It does the opposite, stepping from the global view down to a region and then to a single building, showing only what fits that zoom level. An analyst studying one facility never has to strip away three layers of geography to get there.

Real-time data is a tool, not a requirement
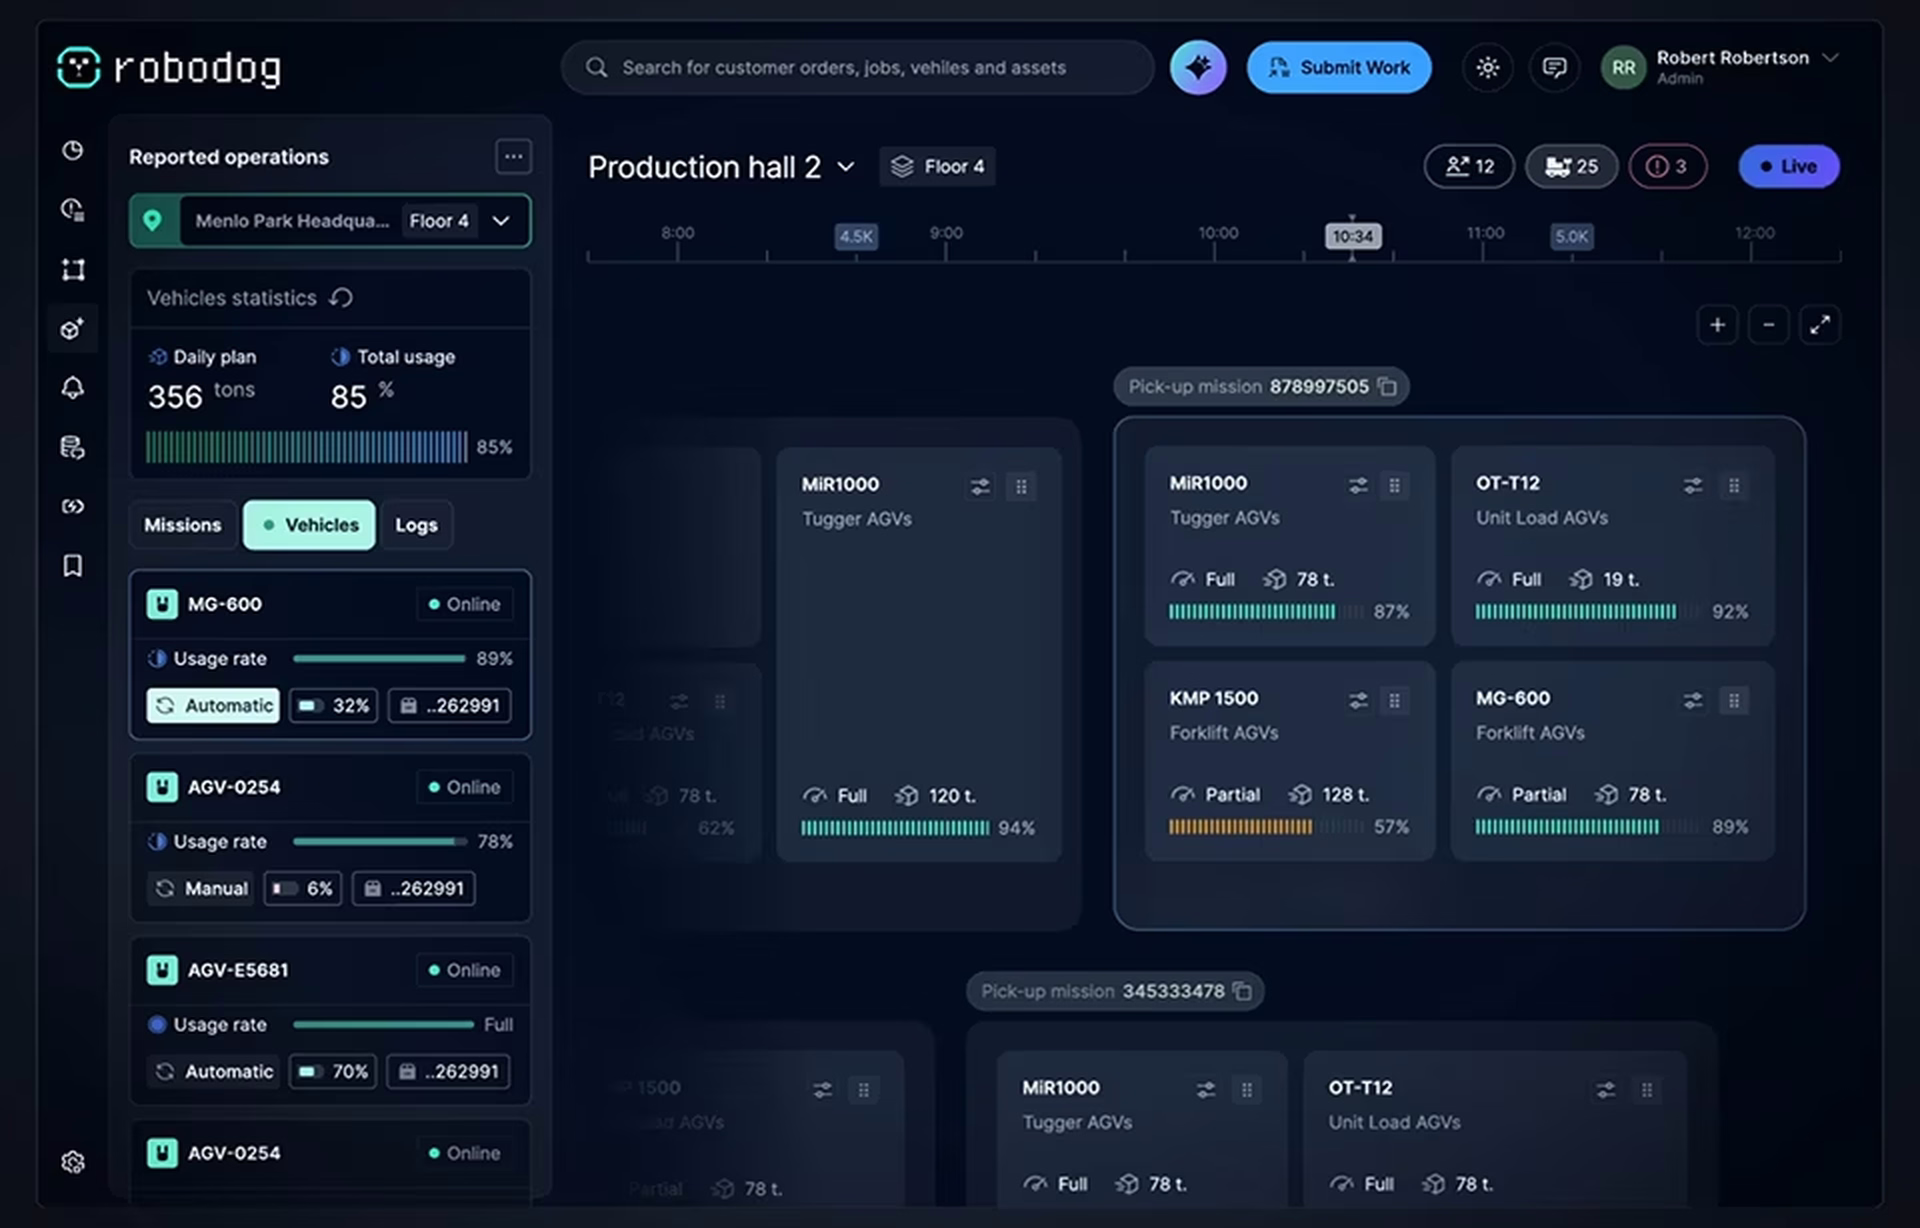
Real-time data is a tool, not a mark of professionalism. Live updates only justify their cost when the decision they support is also live, such as monitoring equipment on a factory line. One quick decision can save a company thousands of dollars, and one late or wrong decision, and you could be looking for a new job. For most executive and operational work, data that is accurate and well understood beats data that refreshes every second and leaves people unsure what they are even looking at.
A manufacturing dashboard tracking equipment failure may need to refresh every few seconds. A monthly spending index does not, because the decisions built on it move on a monthly clock. We have watched teams pour real effort into live pipelines only to learn that users checked the screen once each morning with their coffee. Speed is not the same thing as usefulness.
The monthly spending index we built refreshes on a fixed monthly cycle because it aligns with both the data and the decisions people make based on it. Building real-time infrastructure for a monthly dataset would not have made it more professional. It would have added cost and complexity that the audience never asked for and would not notice. Matching cadence to the actual decision cycle is itself a design choice.
Professional dashboards keep improving after launch
The best dashboards keep changing after launch, because the questions people ask shift as the business does. Amateur teams treat a dashboard like a brochure: build it, hand it over, and move on. A screen that fits today’s decisions can feel useless in six months if nobody watches how it is actually used and adjusts it. The product is never really finished.
What people actually do after go-live matters more than the kickoff workshop: which filters get used daily, which views sit untouched, and where they keep exporting to a spreadsheet because they cannot answer a question inside the tool. Those patterns reveal the gap between what a team asked for and what it actually needs, and that gap is usually invisible on day one.
Improvement works best as small, steady adjustments rather than dramatic redesigns. A filter added here, a default changed there, a chart type swapped once the data proves a different one reads faster. That maintenance is unglamorous, and it is most of what separates a screen people rely on from one they quietly stop opening after the first month.
What this means when you scope a build
Scoping a dashboard well starts with a conversation about decisions, not charts. Before any wireframe, the questions worth answering are who is looking, what they are deciding, and what should disappear from the screen so the answer is obvious. Get those right and the visual layer becomes straightforward; get them wrong and no color palette will rescue it.
None of this argues against strong visual craft. Color, layout, and chart choice still matter, and a sloppy visual layer can undermine sound information architecture. But polish applied on top of the wrong hierarchy just produces a better-looking version of the same failure. Structure comes first, and the surface comes second.
Most of the real work happens before the visuals: understanding users, defining metrics, mapping workflows, and deciding what earns immediate space versus what belongs deeper in the experience. That is where Fuselab’s dashboard development work begins, well before anyone opens a design tool. The screens turn out to be the easy part once those calls are made.
If you would rather see these choices in finished screens than read them in principle, our collection of dashboard design examples shows how the same discipline plays out across industries. It is the better next stop for anyone comparing what strong and mediocre versions actually look like side by side.
The next time a dashboard project lands on your desk, start by asking which single decision the first screen has to serve. Everything after that, the charts, the colors, the filters, follows from that one answer, and the teams that get it right are the ones who edited hardest before they ever started designing.
What makes a dashboard look professional instead of amateur?
Professional dashboards prioritize one clear decision and push everything else a layer deeper, so a viewer knows instantly where to look and what to do next. Amateur dashboards try to display everything at once, which produces a screen that is technically complete but cluttered and hard to act on. The difference is editing, not visual style.
How do you decide what to put on a dashboard and what to leave off?
Deciding what belongs starts with the viewer and the decision, not the data you happen to have. Ask who opens the screen, what they already know, and what they need to decide right after seeing it. Anything that does not serve that decision belongs one layer down, in a filter or a drill-down, rather than on the first screen.
How many charts or KPIs is too many for one dashboard?
Dashboards cross the line when a viewer can no longer tell what matters at a glance, which depends on organization more than on any fixed count. Ten well-grouped metrics can feel simple, while three unrelated charts can feel confusing. A workable rule of thumb is three to five primary metrics on top, with everything else available on demand.
What is the most common mistake in dashboard design?
The most common mistake is trying to answer every possible question on a single screen. Teams pack in every metric anyone requested, and the result is clutter that hides the few numbers that actually drive a decision. A good dashboard sets a clear hierarchy and lets people go deeper only when they need to.
Does a professional dashboard need real-time data?
Real-time data earns its place only when the decisions it supports happen in real time, such as monitoring equipment on a production line. For most executive and business dashboards, daily or weekly updates are more useful than a constant refresh, because accuracy and clarity matter more than raw speed. Live data is a cost, not a badge.
How is a dashboard different from a report?
Reports explain what already happened, while dashboards help people decide what to do next. A report is read once, in an order the author set, and tells a finished story. A dashboard is returned to again and again, and the viewer brings a new question each time, expecting an immediate answer rather than a slow narrative.
How long does it take to design a dashboard properly?
Designing the charts is the quick part, often a week or two. The longer work is discovery and information architecture: for a focused, single-audience dashboard, plan on roughly six to ten weeks end to end, and for a multi-role enterprise platform, three to six months. Rushing the early decisions is what forces expensive rework later.