Datamonitor Healthcare
To monitor disease prevalence across the world and according specific demographics and timeframes.
Informa asked Fuselab to help create a human centered UX for a critical application in the Pharmaceutical industry. The Datamonitor system allows pharmaceutical manufacturers and researchers the ability to determine where there is the largest need for their products, and the ability to track the success of existing treatments for specific diseases across the world and over specific periods of time.
Context &
Relevance
Goal
Our goal was to create a UX design that would be 100% intuitive to use and would require no explanation or training. Users should be able to immediately create unique research criteria and produce customized data-rich reports.
Relevance
Data resources large enough to facilitate disease statistics across the world are not easily deployed. Data cleansing and structuring were key preparation steps in order to properly deploy our proposed functionality and data flow.
Our approach to creating effective data visualization relies heavily on understanding the total amount of data available, the specific data types and the relevance for the pharma industry.


Map/Chart
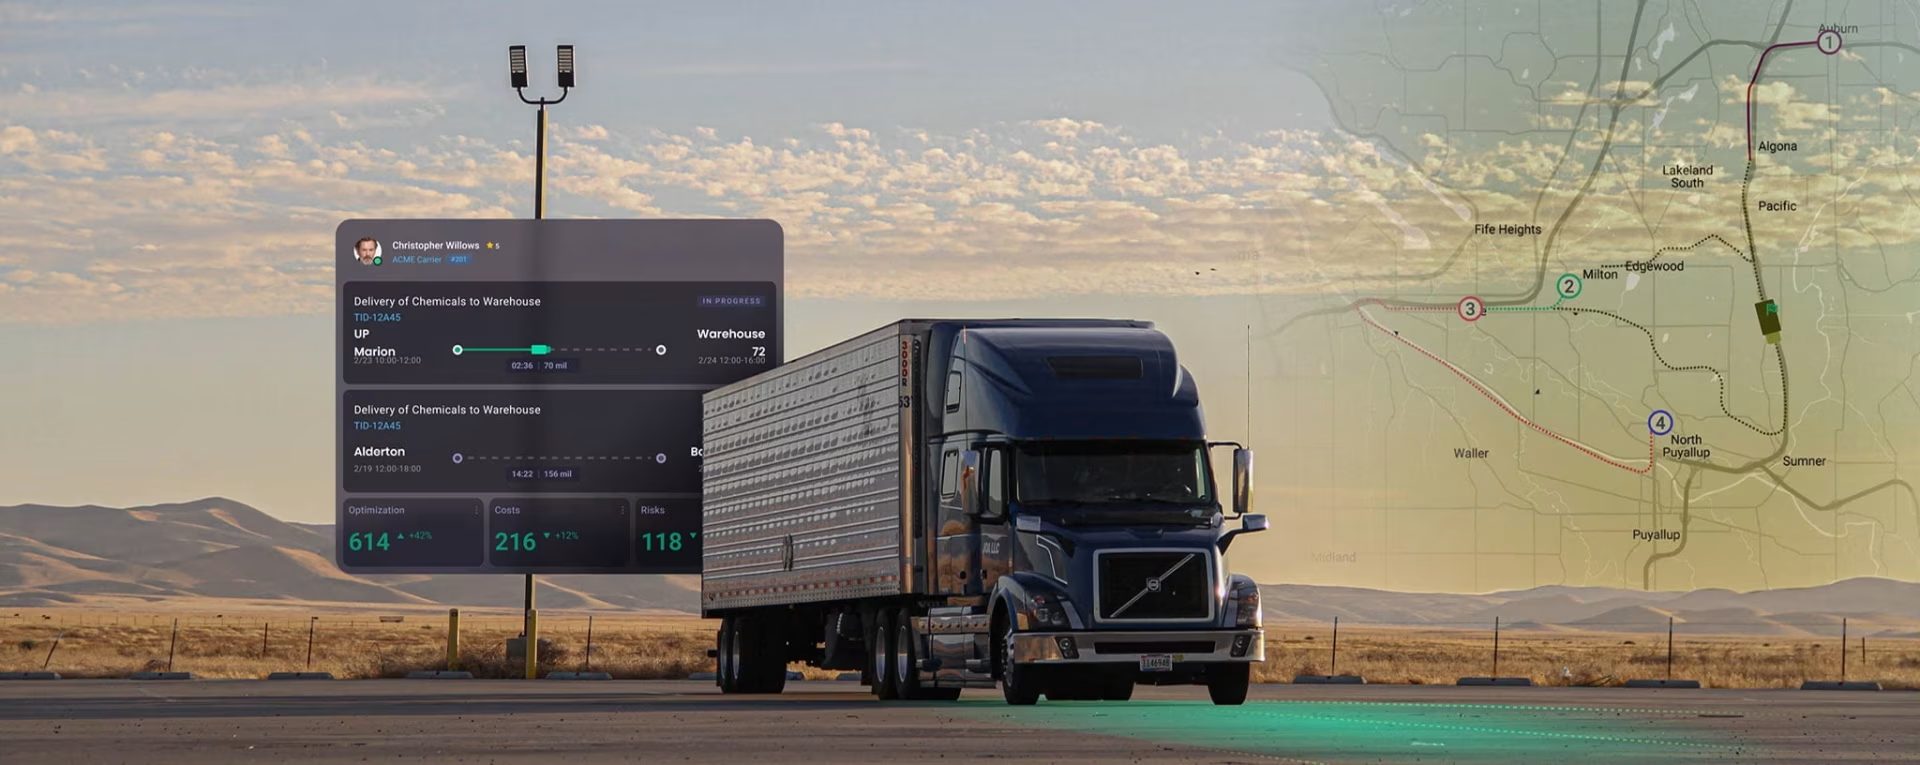
High-level map data visualizations were developed to give the user a kind of orienting point to begin to better understand what is possible as they dig deeper into the data and begin to select data filters needed to achieve their user goals.


Sankey Chart
A Sankey diagram was designed to give users the most comprehensive view of the data possible, while also allowing for individual country deep dives for more detailed data.


Research and analysis
Sometimes the more simple the data visualization the better. This view allows users to quickly see where particular disease numbers are the highest and begin to dig into the specific country data to discover more details.


Designed by:
Art Direction
George Railean
Design
Marcel Sendrea
Lina Ghimp
Project management
Vladimir Bobu
Do you want to create something similar?
Get a free estimation for your project requirements and start it within 24 hours.
Related Services and Solutions
Don't Listen to Us, Read What Our Clients Are Saying.
We know that trusting an outsider with your vision can be scary. This is why if you're not satisfied with us after the first two weeks, you can walk away owing us nothing.
"We went from prototype to usable software lightening fast, and our customer reviews have never been better."
"Their creativity and mastery of UX UI design has made our years of working together enjoyable and incredibly successful!"
"If you need to re-think your product and need some truly unique design talent , Fuselab Creative design team is your answer."
"We needed a nimble team of UI UX designers to work with our development team and they quickly became one of our most vital resources and far exceeded our expectations."