Fiserv Small Business Index
Data-Driven. Comprehensive. Reliable.
This web platform we designed and developed for Fiserv was created to serve those interested in understanding consumer spending trends across the U.S. Interactive data visualization modules, GIS based mapping, and sophisticated search by sector or region, make this one of the most unique Indexes available today.
Index
Overview
The UX/UI design needed to be very flexible to accommodate for monthly data updates and content that would expand and contract depending on the report for that month. And as is always a ubiquitous requirement, the platform needed to work equally as well in a mobile environment.

Biz Sector Index
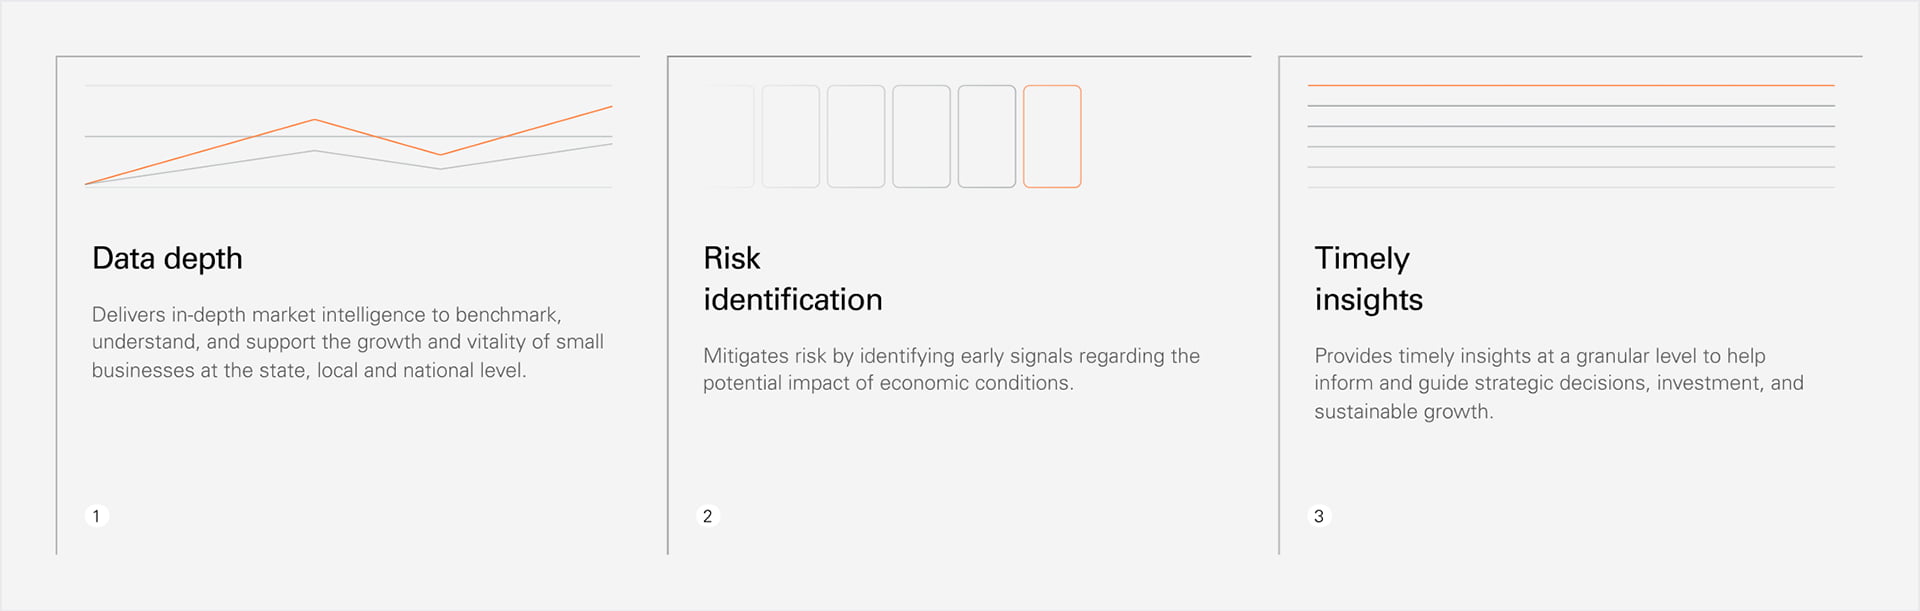
Subtle thumbnail photography mixed with extremely modern data visualization in business, gives the Fiserv sector index an incredibly interesting in useful look and feel.

Every month the index is automatically updated with new data and highly-informational data insights from spending trends from the last 30 days.
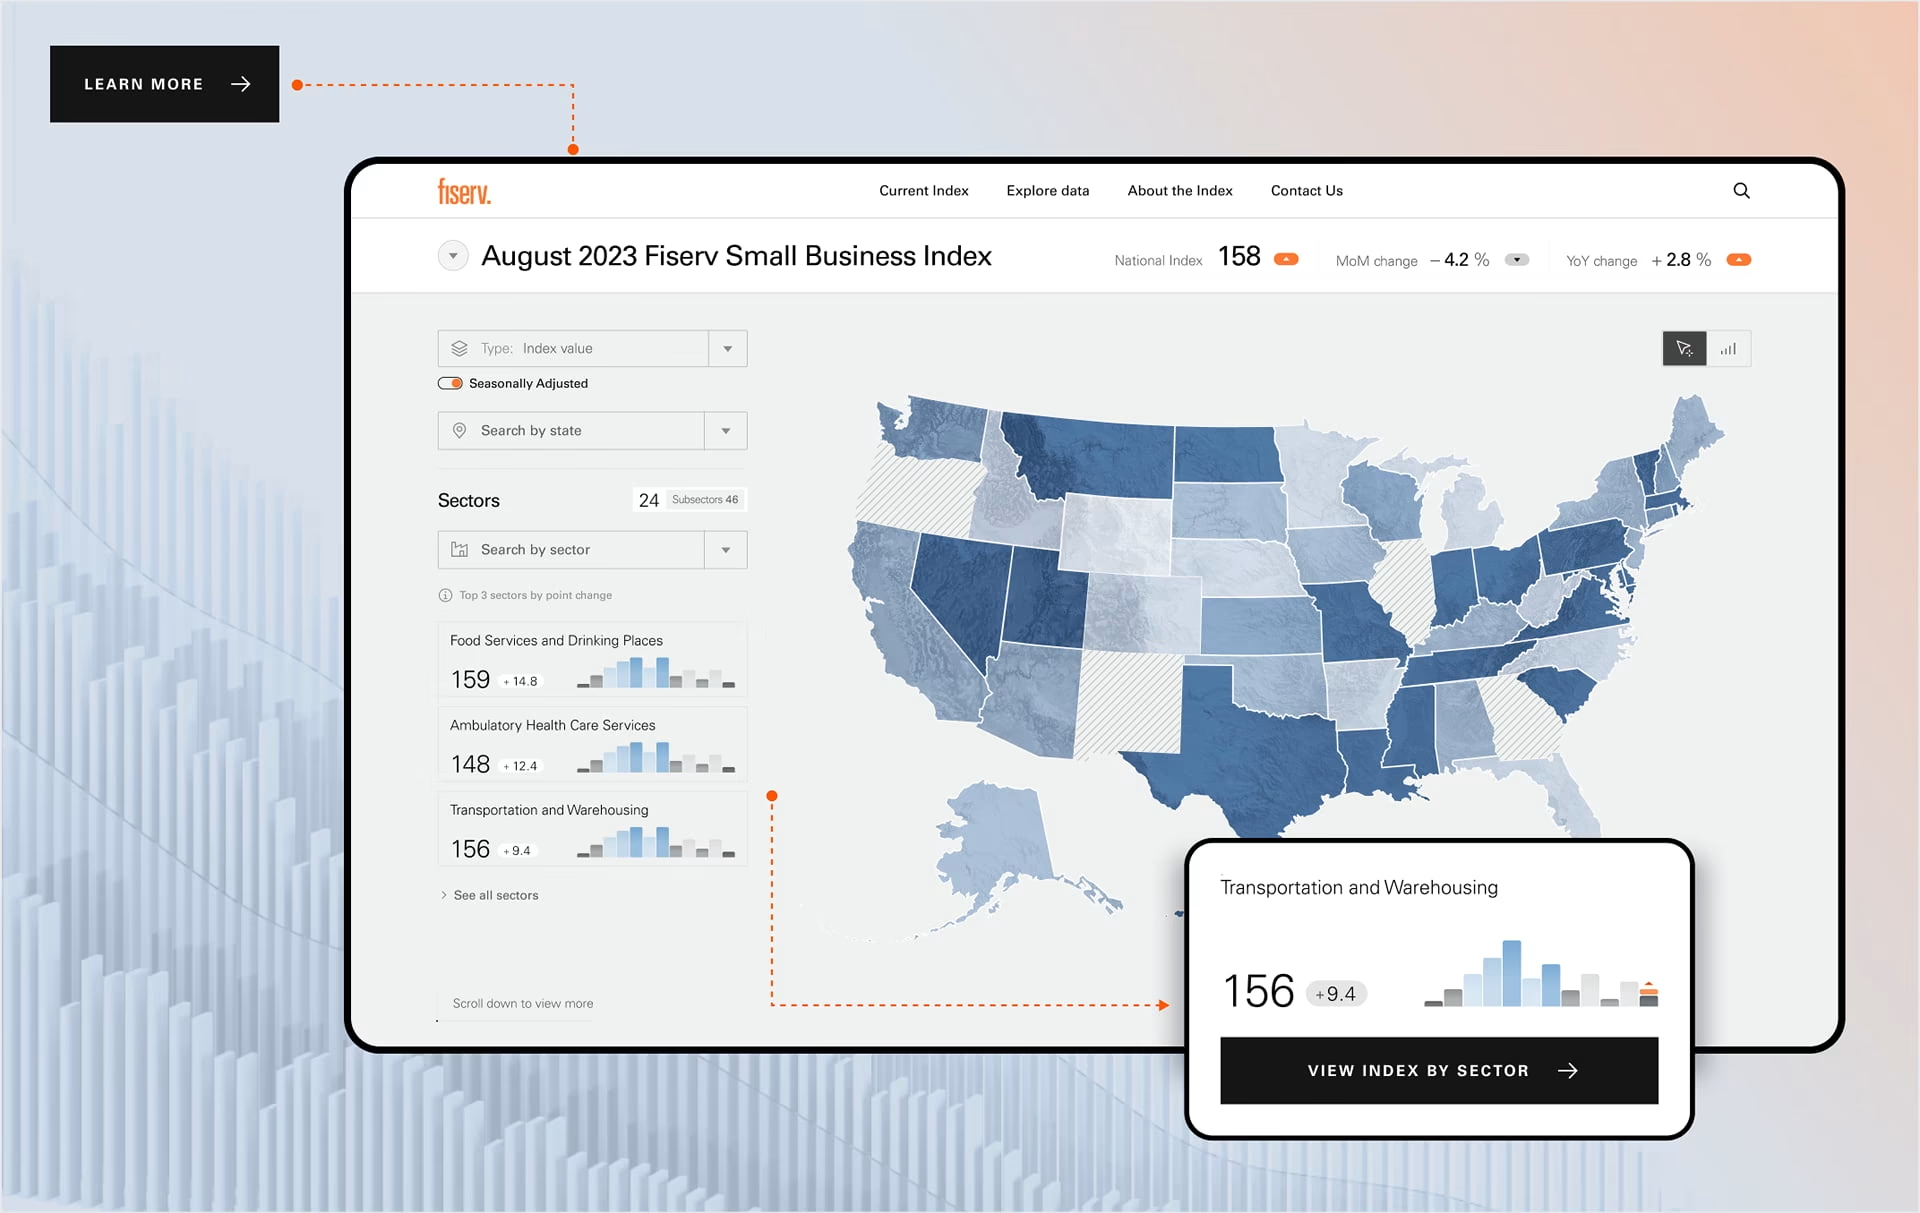
These indexes serve as important tools for policymakers, economists, investors, and small business owners themselves to track trends over time, and make informed decisions. The taxonomy hierarchal content strategy and UI/UX data visualization design make this platform extremely intuitive and yet still allow for deep data insights the more the user filters according to their needs.
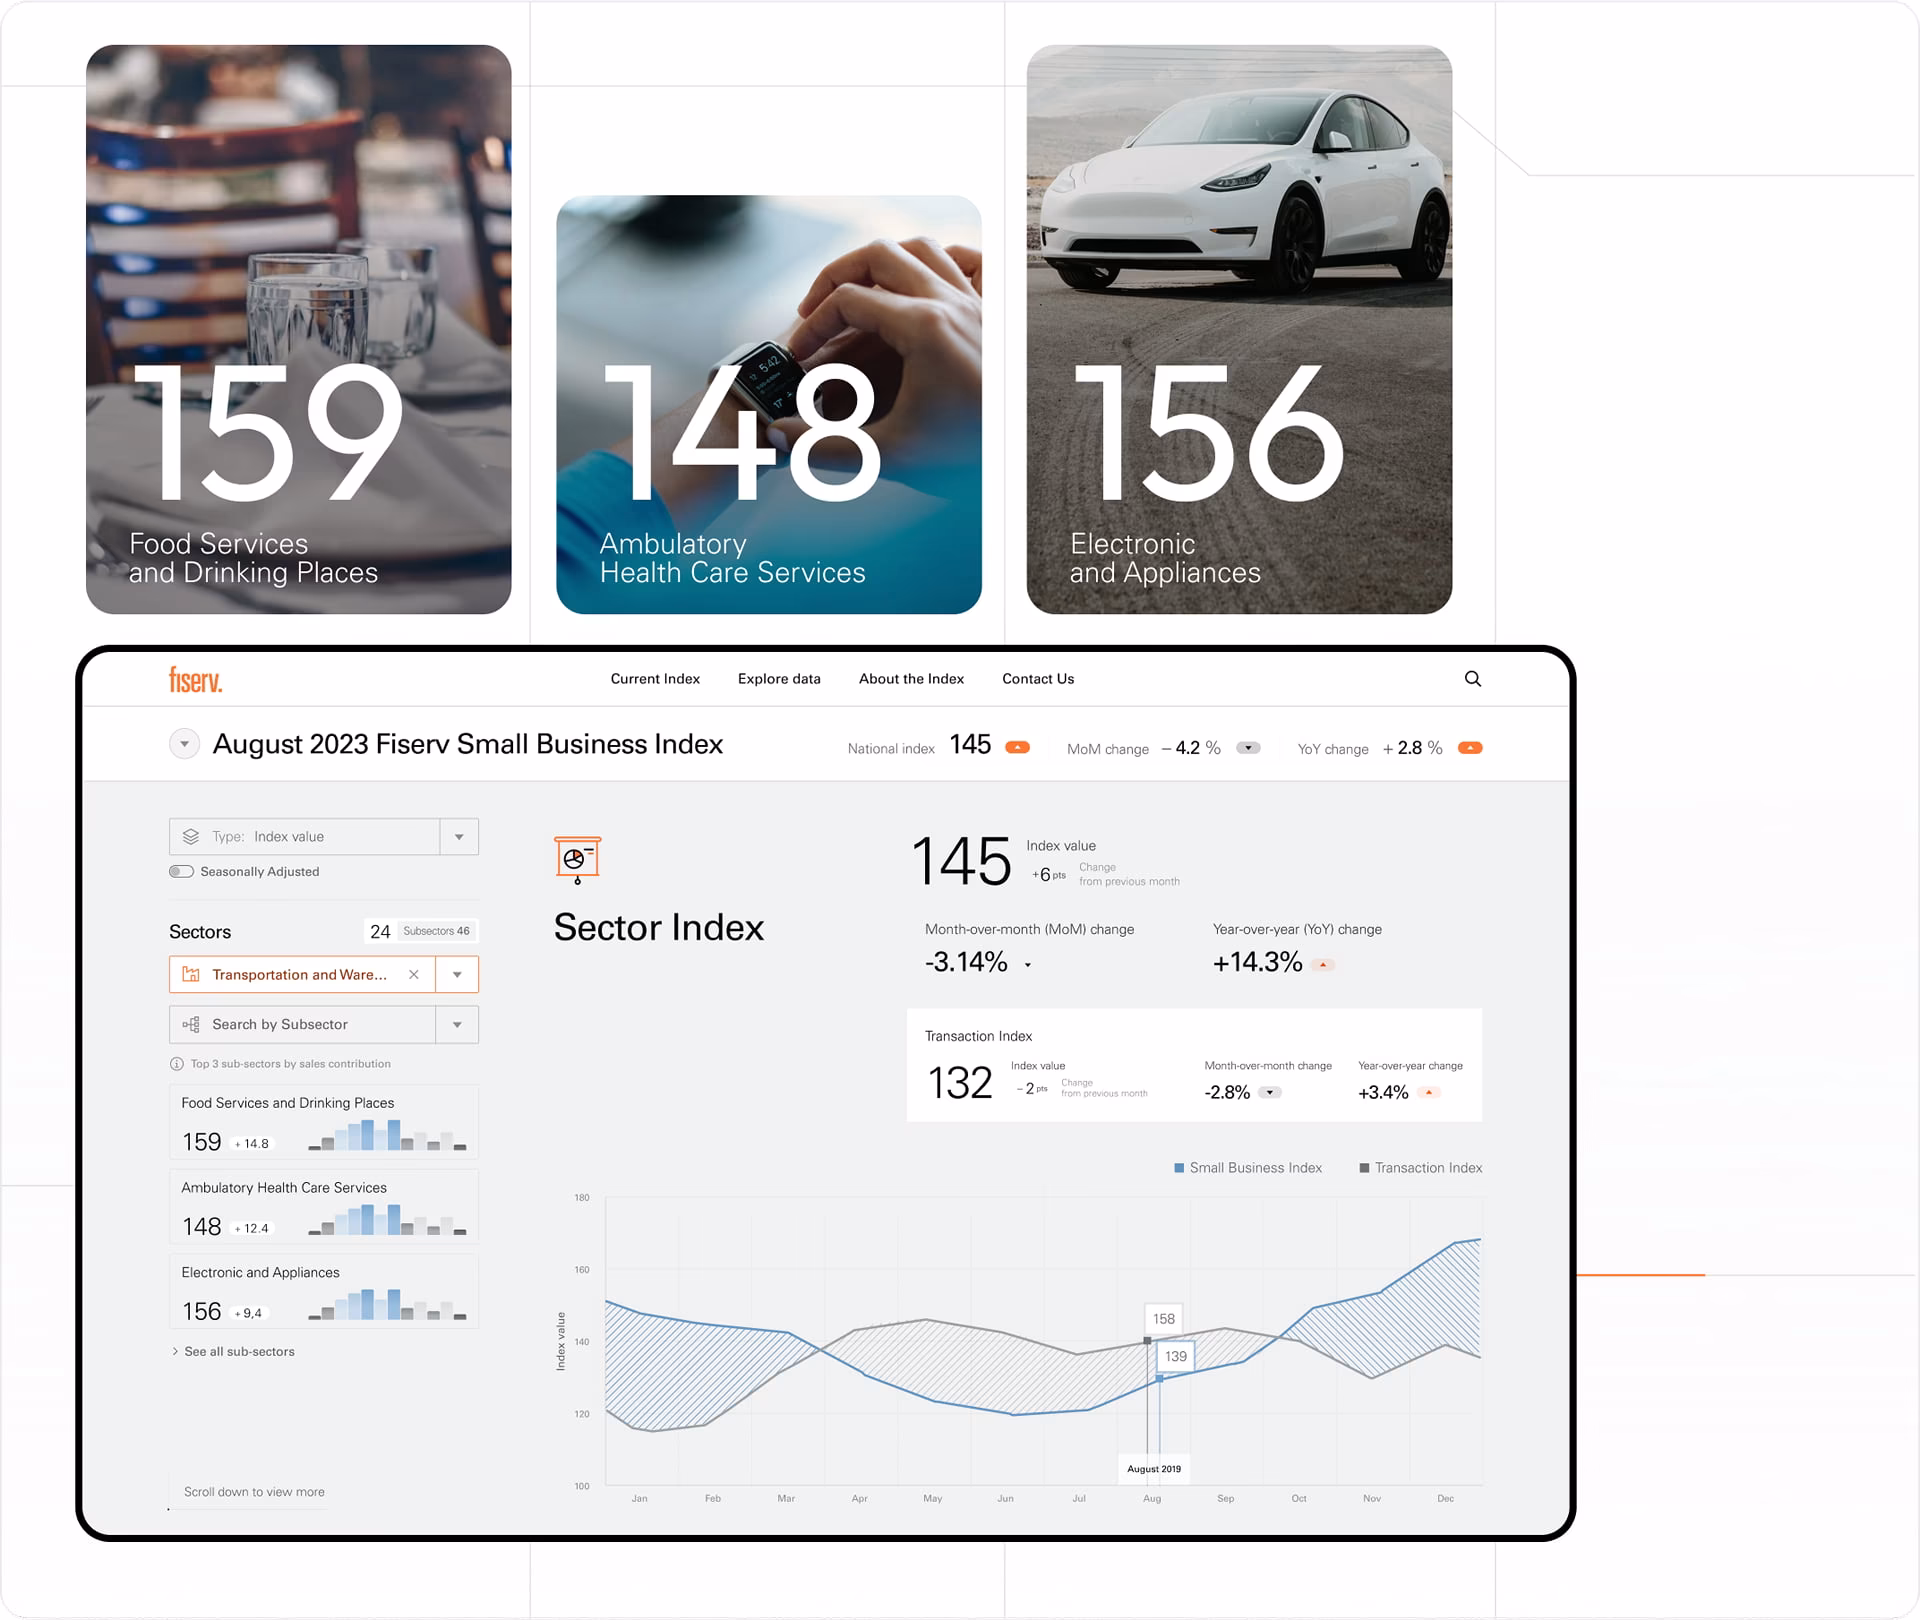
UX Strategy
The Fuselab UX strategy began with developing a site map for the entire experience, verifying with users that the architecture and proposed design thinking in fintech content strategy makes sense for potential users.

Each Small Business Index provides an expert summary coming along with the latest data presented like the chart below.

Navigation allows for in-depth and simple research for each particular state with only a few clicks.

Business Index
by State
As a vital growth engine, the small business market has a need for timely, reliable, consistent, and easily accessible measurement of growth or decline that is 100% data-driven and based on actual sales, and not estimated from survey or sentiment-based measures. Simple and intuitive UX design agency for banking and fintech is more important than ever.
Simple data visualization for business and functional comparison features were designed to drive users directly to the data they are most interested in and be able to quickly compare this data with measures like the national average.
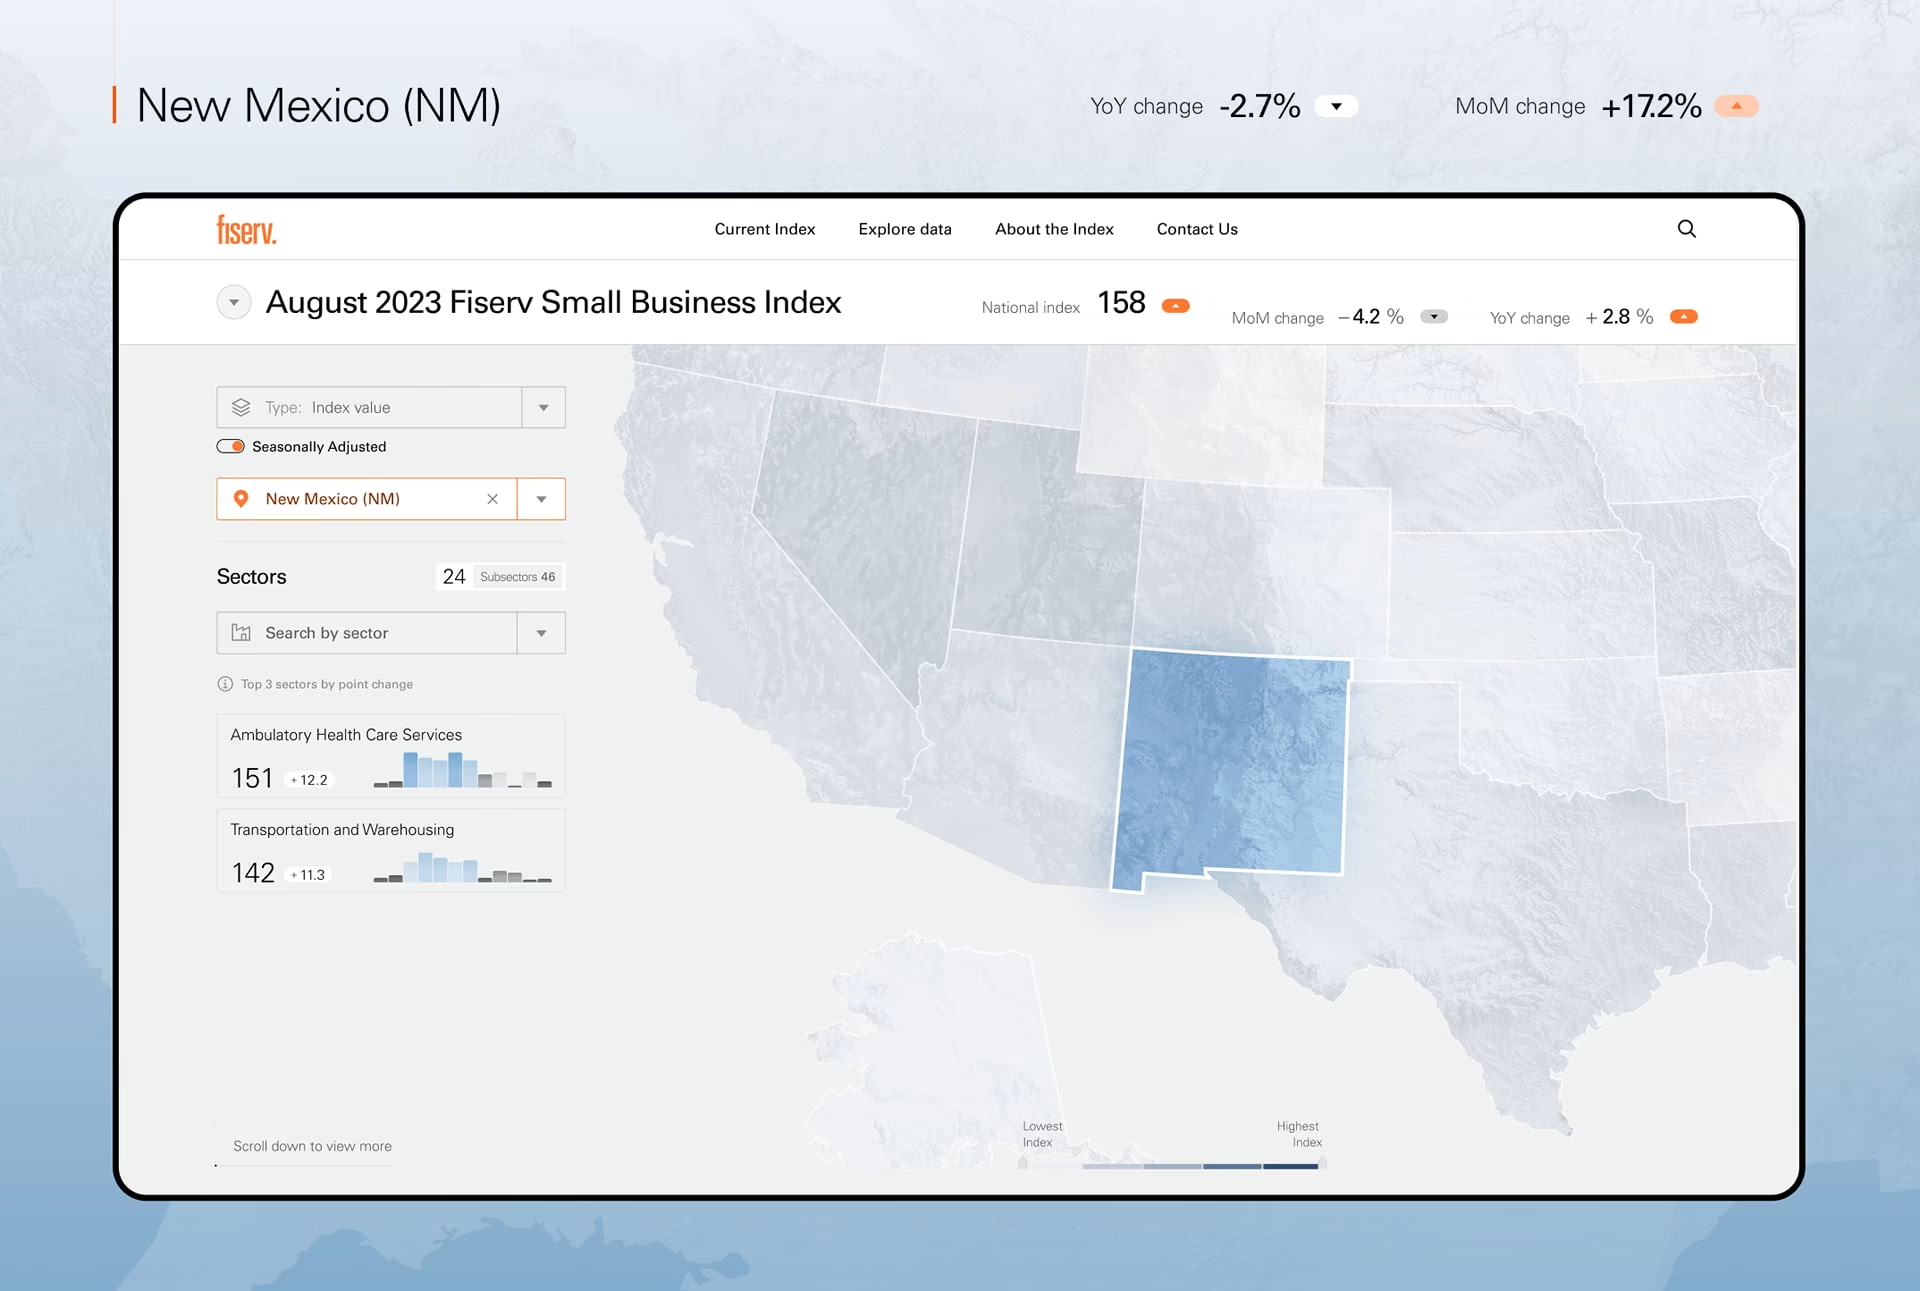
Interactive and automated line maps, with unique hover capabilities, were designed to create effective data visualizations in a very compact landscape.

Subtle gradient colors were used to create important contrast among the more data-rich areas of individual data viz blocks, while more simple contrast colors were used in the visual itself.

Current Index
Summary
All of the data and data visualizations created for this web based business platform began with the primary screens which contained high-level summary information, allowing users to dig in on particular data sectors to view deeper data insights.
Business sales are broken down by particular sectors and timeframes. The UX allows users to immediately see the changes in this data for each new month along with historical trends.
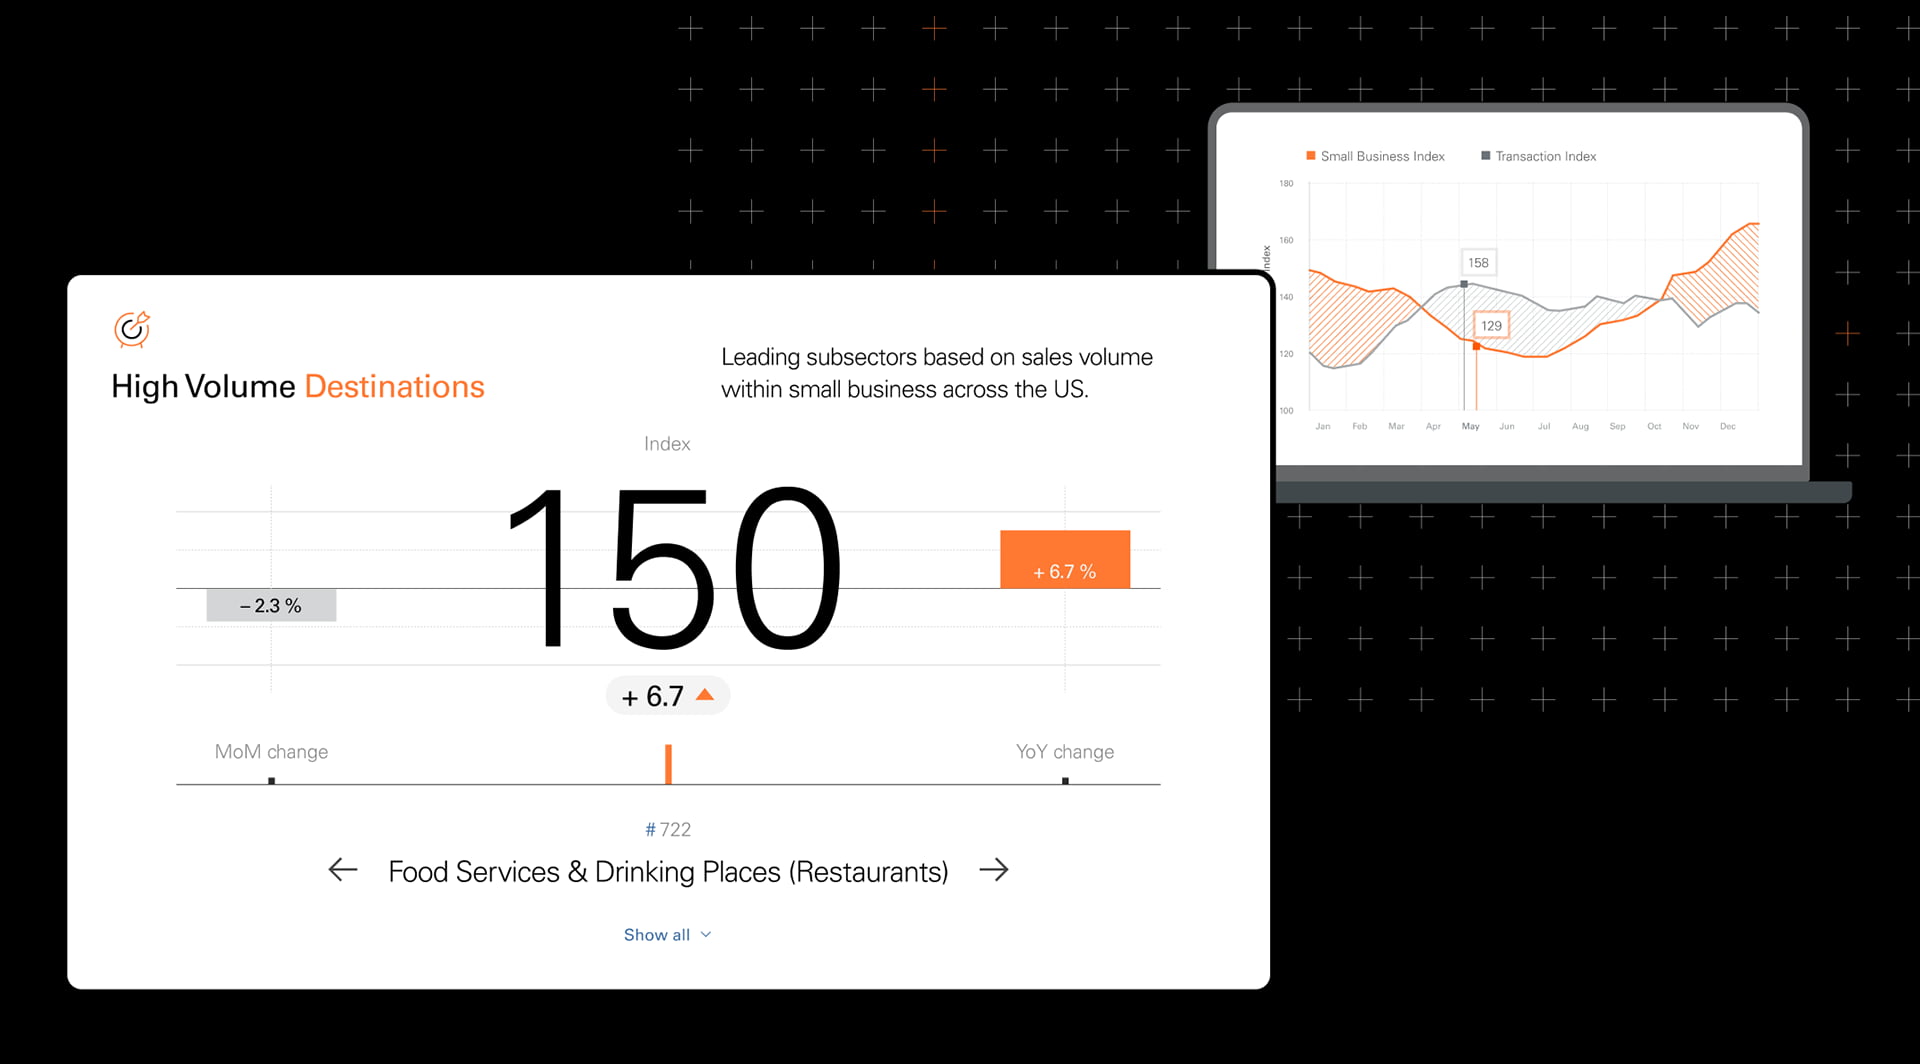
The strength of an index like this is its stellar UX/UI design strategy, paired with data based on actual sales without estimations or predictions getting in the way of the facts.

The Index is based on point-of-sale transactions from approximately two million small businesses.

Small businesses are organized based on the North American Industry Classification System (NAICS).
Designed by:
Art Direction
George Railean
Project management
Vladimir Bobu
Design
Andrei Sava
Lina Ghimp
Do you want to create something similar?
Get a free estimation for your project requirements and start it within 24 hours.
Related Services and Solutions
Don't Listen to Us, Read What Our Clients Are Saying.
We know that trusting an outsider with your vision can be scary. This is why if you're not satisfied with us after the first two weeks, you can walk away owing us nothing.
"We went from prototype to usable software lightening fast, and our customer reviews have never been better."
"Their creativity and mastery of UX UI design has made our years of working together enjoyable and incredibly successful!"
"If you need to re-think your product and need some truly unique design talent , Fuselab Creative design team is your answer."
"We needed a nimble team of UI UX designers to work with our development team and they quickly became one of our most vital resources and far exceeded our expectations."