Grid.ai / Lightning AI Machine Learning Dashboard Design
Lightning AI, formerly Grid.ai, is a platform for machine learning engineers to train, run, and manage ML experiments at scale. Fuselab designed the UI/UX and full design system for two products: Train for experiment tracking and Blueprints for workflow automation. Both are fully implemented and live.
Lightning AI rebranded from Grid.ai after these products shipped. Train was Fuselab’s first engagement, covering the complete UI/UX for the ML experiment tracking platform. Blueprints followed as the second product. Both were designed by Fuselab and implemented by Lightning AI’s internal development team. Both are currently live.
With Fuselab, we've received far beyond what we expect they can deliver.
Single-Screen Navigation for Complex ML Workflows
Machine learning workflows involve filtering large experiment datasets, comparing run results, and navigating between sessions without losing context. The entire Train platform was designed to function within a single screen using tabular navigation and contextual filtering so engineers never need to leave the dashboard to find what they are looking for. A site map was built for every user flow before a single screen was designed to ensure navigation decisions were based on how engineers actually work rather than how the data was structured.

As site map was created initially for every type of user-flow to make sure we are always designing for maximum efficiency.

Design System Built for an ML Platform That Scales
Fuselab delivered a full design system for Lightning AI covering navigation patterns, button states, popover behavior, support messages, and error states. A design system for an ML platform has to account for a wide range of interface states including loading, error, empty, and edge cases where data is incomplete or a run has failed. Every component was documented so Lightning AI’s internal development team could implement accurately and extend the system independently as the products evolved.
For a design system to be effective, every single pixel is allotted and accounted.


Recorded voice clips are listened to and validated for accuracy. Along with validating yes or no, clips can be reported to help improve accuracy of the dataset.

Recorded voice clips are listened to and validated for accuracy. Along with validating yes or no, clips can be reported to help improve accuracy of the dataset.

Data Visualization for High-Density ML Experiment Results
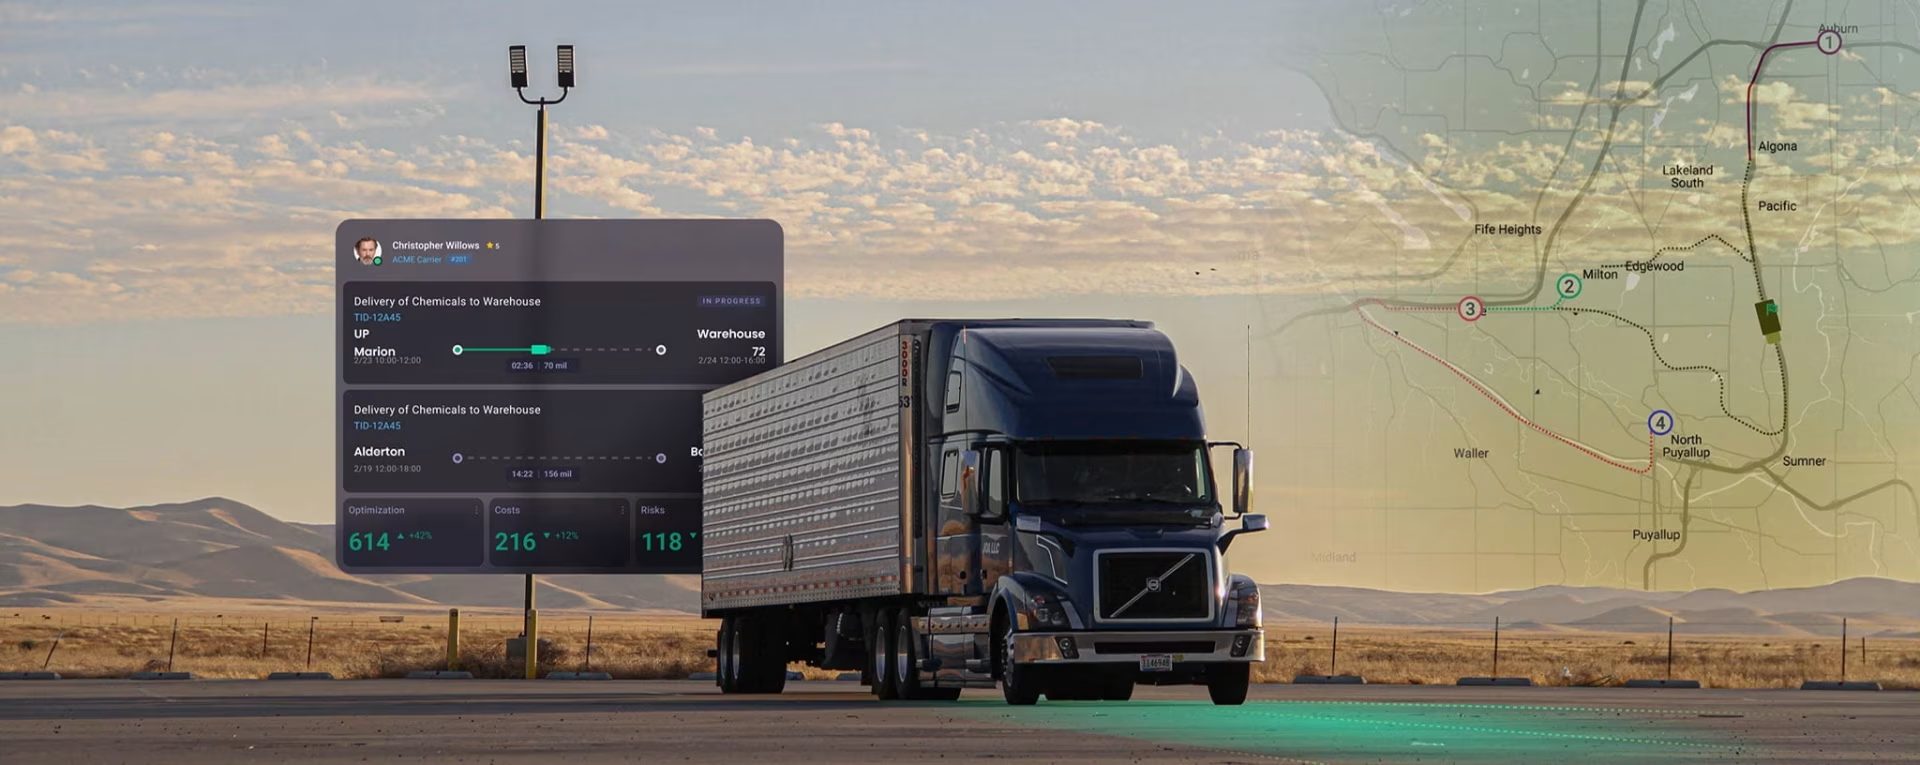
ML experiment dashboards carry an unusually high information density. A single training run generates metrics across loss curves, accuracy scores, hardware utilization, and cost simultaneously. The visual design for Train uses high-contrast color blocks, thin-line containers, and subtle drop shadows to create a hierarchy where the most significant result reads first without the overall display feeling crowded. The goal was an interface where an engineer can open a completed run and understand the result in seconds, not minutes. This is what distinguishes AI interface design for technical users from standard product design.
Thin lines and rounded boxes with subtle drop-shadows were used to deliver a modern visual hierarchy that also provides a stratically designed data interface that makes selection and interaction quite easy.

Toggle switches, accordion boxes, simple check marks; all work together to create a easy to understand user experience with no specific training or instructions.

Information Density Without Visual Noise
The overview layer presents the full scope of a project’s experiments in a single view. A strict grid structure organizes the data without making the grid itself visible to the user. Bold text, hover states, selective color usage, and high-contrast blocks work together to produce an interface that communicates clearly without requiring labels or instructions. An engineer encountering it for the first time can navigate without documentation.
All modern design needs to adhere to some kind of grid, but the signe of an expert UI designer, is that the grid actually helps better understand the content instead of distracting from it.

Whether it is bold text, hover states, sparce color usage, or extremely high-contrast blocks, it all needs to work together to produce an interface that is simply self-explanitory.

Whether it is bold text, hover states, sparce color usage, or extremely high-contrast blocks, it all needs to work together to produce an interface that is simply self-explanitory.

Whether it is bold text, hover states, sparce color usage, or extremely high-contrast blocks, it all needs to work together to produce an interface that is simply self-explanitory.

Fixed Navigation Alongside a Dynamic Display Area
The core structural decision in Train’s interface is a fixed navigation panel paired with a dynamic display area. The navigation never changes regardless of what the engineer is viewing. The display area updates based on what the user selects. This separation means engineers always know where they are and how to get to anything else, even when the content of the main area is complex or unfamiliar. It is a principle that becomes essential when users are managing dozens of experiments simultaneously.

Grouped Metrics and Visualization for Experiment Comparison
Experiment results are displayed in multiple formats to support different analytical needs. Heat maps allow engineers to scan a large set of results and identify high-impact areas without reading through individual run logs. Spider visualization groups related metrics into segmented clusters, making it easier to compare the performance profile of one experiment against another across multiple dimensions simultaneously. Both visualization types were selected specifically for ML use cases where the number of variables per experiment makes row-by-row comparison impractical. The same principles apply across Fuselab’s broader data visualization design work for technical platforms.

Heat maps have been utilized here to give user the ability to quickly scan and see high impact areas and be able take action based on this data without having to read through endless charts and graphs.

Spider visualization creates a terrific data visual grouping technique for the filtering of large data sets within manageable segmentation.

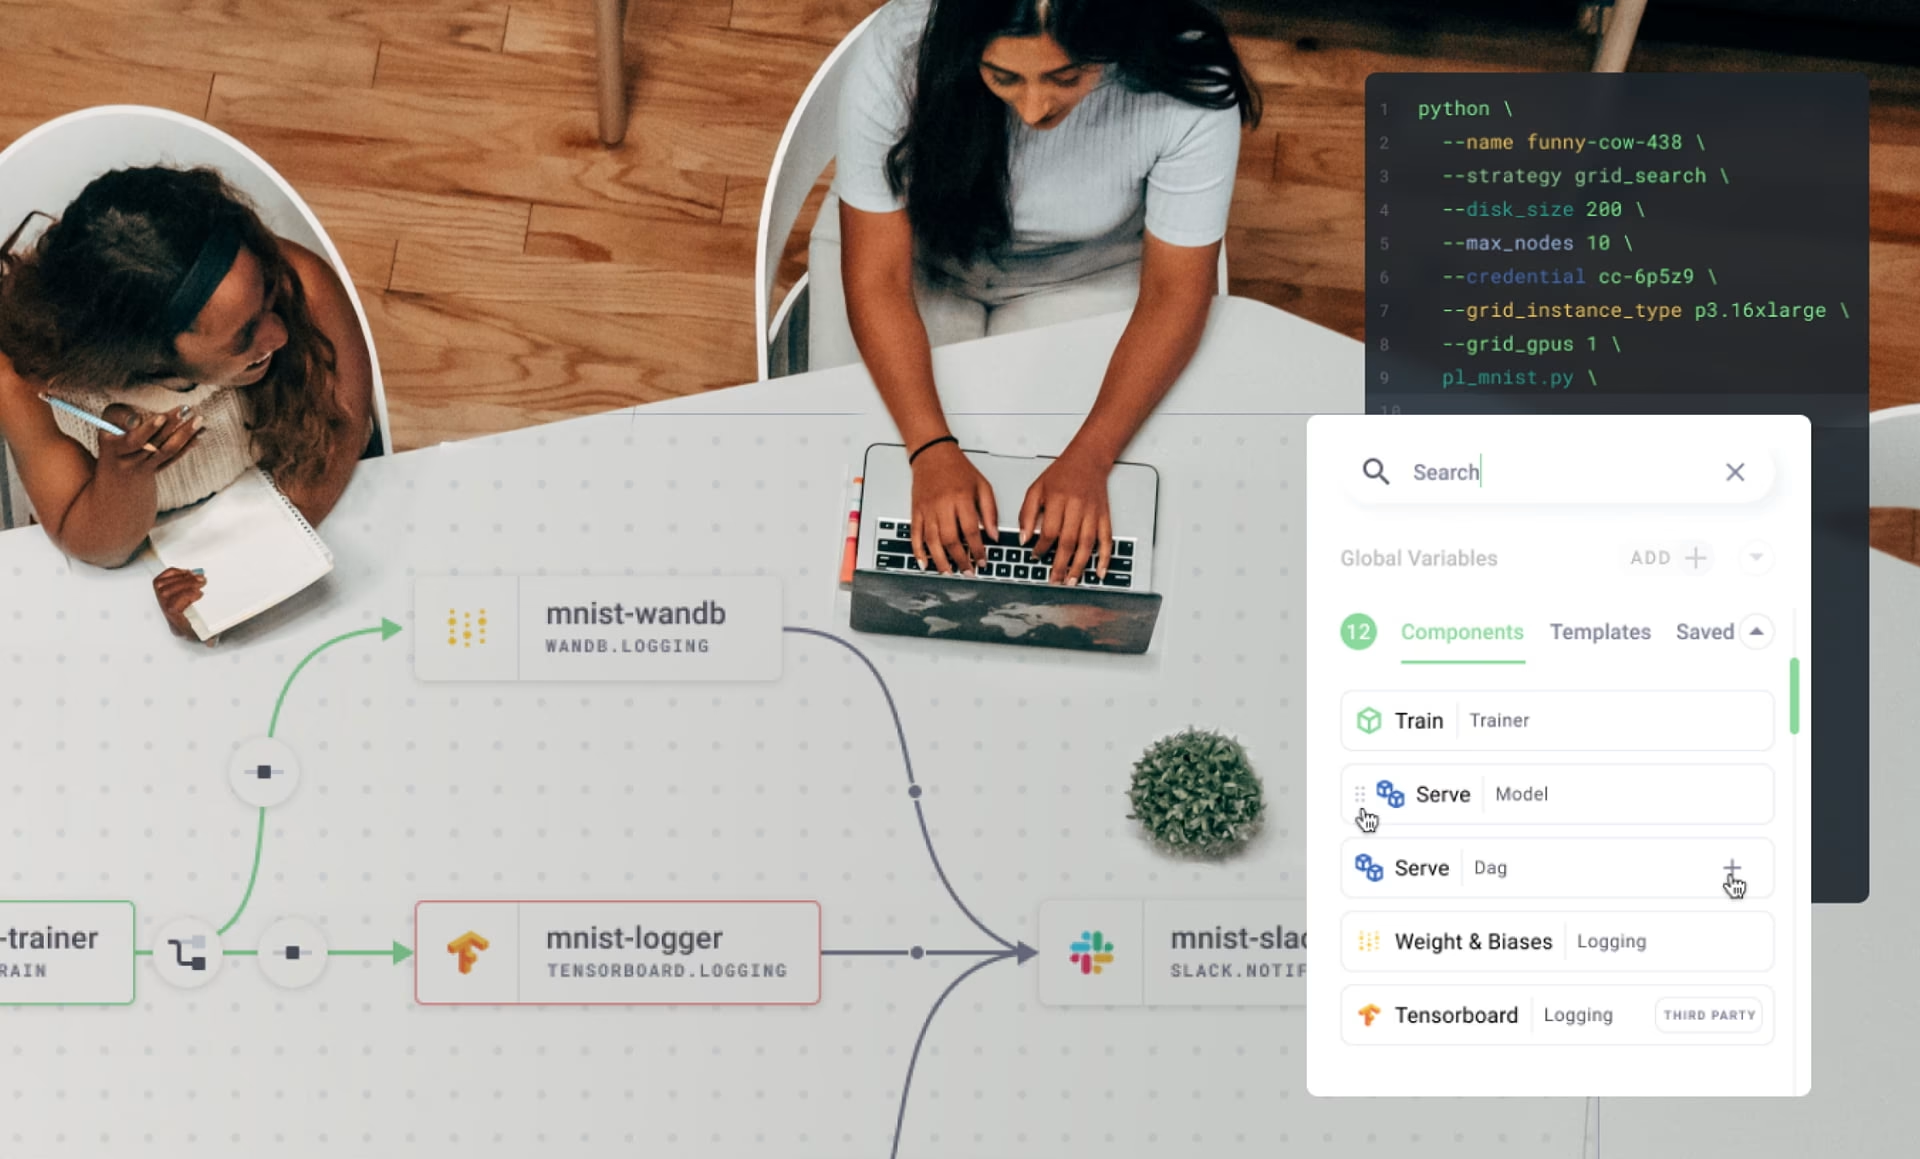
Inline Code Access for Engineers Who Need Both Views
ML platforms serve users who move between visual interfaces and direct code access depending on the task. Train includes an inline code view that allows engineers to access the codebase without leaving the interface. A split-panel layout keeps the visual dashboard and the code editor in the same viewport for engineers who need both simultaneously. The same session data is accessible from both views so switching between them does not interrupt the workflow or require reloading context.
When needed accessing the code base without having to leave the interace completely can be a true gift to users who need it.

While others prefer more of a visual code, we have created a user interface for these users as well.

Designed by:
Art Direction
George Railean
Project management
Vladimir Bobu
Design
Marcel Sendrea
Lina Ghimp
Andrei Sava
Machine Learning Dashboard Design: Common Questions
What is machine learning dashboard design?
Machine learning dashboard design is the practice of creating interfaces that give ML engineers a clear, fast view of experiment results, compute costs, run status, and dataset health in a single workspace. It differs from standard analytics dashboard design because the users are technical specialists working with high-density data outputs who run multiple experiments simultaneously and need to compare results across dozens of variables without leaving the interface. For Lightning AI, formerly Grid.ai, this meant designing Train so that experiment tracking, cost monitoring, data issue management, and result evaluation all live in one screen. The interface supports filtering and tabular navigation without any page transitions, so engineers stay in context from the moment they open a run to the moment they evaluate its output.
What is the difference between designing for ML engineers and designing for general business users?
General business users need dashboards that explain data in accessible language and guide them toward obvious next actions. ML engineers already understand the data. They need interfaces that stay out of the way and let them work fast. For Train, this shaped every structural decision. Labels were minimized. Information density was maximized. The navigation panel never changes regardless of what the engineer is viewing. Code access is available inline without opening a separate terminal. Cost totals are persistent across all views. These decisions came from mapping how Lightning AI’s engineers actually move through a training run, from setup through evaluation, and removing every step that required switching tools or losing context. The design challenge on this project was not making things simpler. It was making things faster.
What does a design system for an ML platform need to include?
A design system for an ML platform needs to cover every state the interface can enter during a training run, not only the success states that appear in design mockups. That includes loading states when a run is in progress, error states when a run fails or data is incomplete, empty states when a project contains no experiments yet, and edge cases where results are partial or inconclusive. The design system Fuselab built for Lightning AI covers navigation patterns, button states, popover behavior, support messages, and error states across all of these scenarios. Every component is documented with implementation specifications so Lightning AI’s internal development team could build accurately and extend the system independently as both Train and Blueprints evolved without returning to Fuselab for clarification on every new feature.
What are heat maps and spider visualization used for in ML experiment tracking?
In ML experiment tracking, heat maps give engineers the ability to scan a full set of run results and immediately identify which experiments performed well and which did not, without reading through individual logs line by line. High-performance runs stand out visually from low-performance ones across the complete experiment set. Spider visualization, also called radar chart visualization, groups multiple metrics for a single experiment into a normalized visual format where the performance profile of one run can be compared against another across several dimensions simultaneously. In Train, both visualization types were chosen specifically because a single Lightning AI experiment generates multiple distinct metrics and row-by-row table comparison becomes impractical at scale. The visualizations do the comparative work so engineers can focus on what the results mean rather than how to read them.
What is single-screen navigation and why does it matter for developer tools?
Single-screen navigation means every action a user needs to complete their primary workflow is accessible from one view without navigating to a separate page or opening a new context. For Train, this was a primary design constraint. An ML engineer moving through a run cycle needs to access experiment filtering, result comparison, cost monitoring, and inline code editing. In most platforms these live across separate pages or separate tools. In Train they are all resolved within the same viewport. The navigation panel is fixed and never changes regardless of what the engineer is viewing, so they always know how to reach anything else without losing their current context. The entire site map for Train was built around this principle before a single screen was designed, mapping every user flow to confirm the structure supported it before the visual design began.
How is inline code access designed into a visual ML interface?
Inline code access in a visual ML interface means the engineer does not need to leave the dashboard and open a separate terminal or IDE to inspect or modify the underlying code for a run. Train includes a code view accessible directly from the experiment interface, with a split-panel layout that keeps the visual dashboard visible alongside the code editor at the same time. Session data is consistent across both views so switching between visual and code mode does not reset the current context or require the engineer to reload anything. This design decision came from observing how Lightning AI’s engineers actually work: visual output and code are not separate workflows, they are two perspectives on the same task, and separating them into different tools creates a context switch that interrupts the thinking process, not just the navigation.
Does Fuselab design and develop ML platforms or only design them?
For Lightning AI, Fuselab’s scope covered UI/UX design and the full design system for both the Train and Blueprints products. Development was handled entirely by Lightning AI’s internal team. Fuselab delivered all design assets, component documentation, and interaction specifications to a standard that allowed direct implementation without a gap between what was designed and what was built. Both products are fully live. For clients who need design and development under one engagement, Fuselab also handles full-stack product builds including backend development and API integration. For clients who have strong internal development teams, as Lightning AI did, Fuselab focuses on delivering a design system thorough enough that the team can build, extend, and maintain the product independently long after the engagement ends.
Do you want to create something similar?
Related Services and Solutions
Don't Listen to Us, Read What Our Clients Are Saying.
We know that trusting an outsider with your vision can be scary. This is why if you're not satisfied with us after the first two weeks, you can walk away owing us nothing.
"We went from prototype to usable software lightening fast, and our customer reviews have never been better."
"Their creativity and mastery of UX UI design has made our years of working together enjoyable and incredibly successful!"
"If you need to re-think your product and need some truly unique design talent , Fuselab Creative design team is your answer."
"We needed a nimble team of UI UX designers to work with our development team and they quickly became one of our most vital resources and far exceeded our expectations."