
POGO
Find out where Covid-19 funds were spent.
POGO came to Fuselab Creative to design one of the most important government spending oversight platforms in U.S. History.
Pogo Tracker
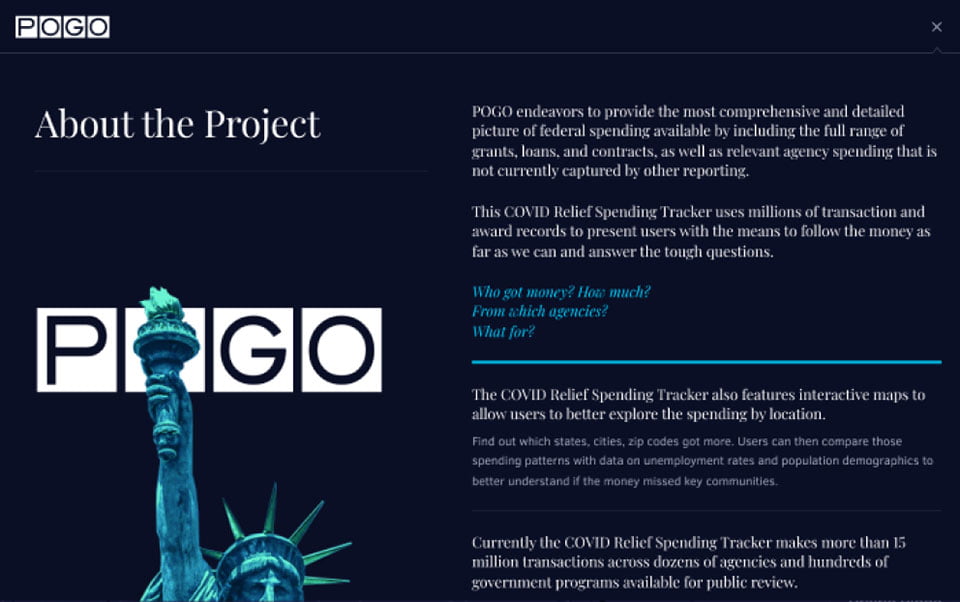
COVID-19 Government spending falls into numerous types, such as loans, grants, contracts of all types, and agency budget support. It’s a difficult geography to navigate, and this is why the POGO tracker is so important to our democracy.
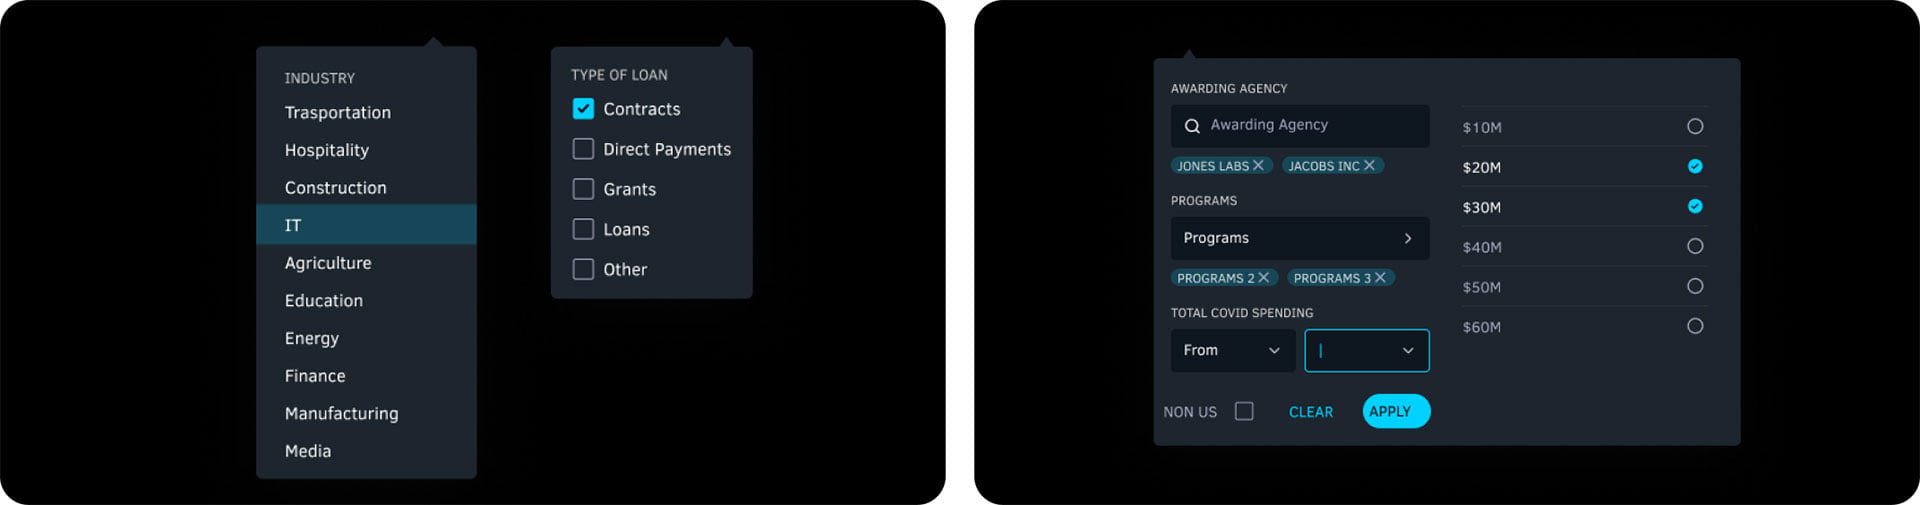
Wireframe
The Fuselab wireframes needed to account for an incredibly complex set of data inputs, while also creating a simple and intuitive experience for all users from all levels of technical proficiency.

Find out
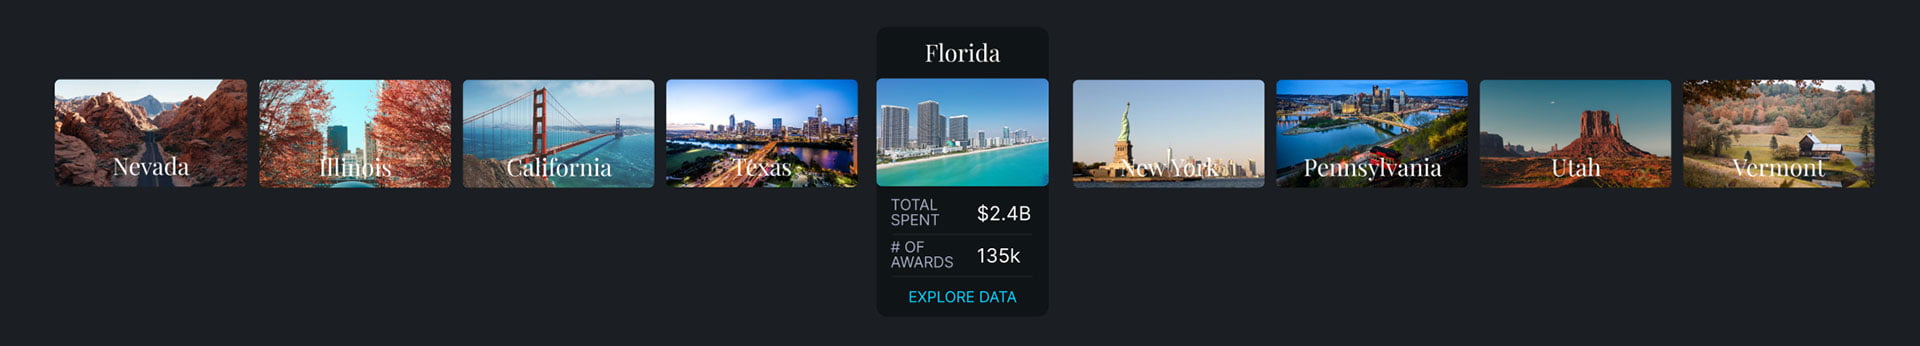
Users of this tracker have the opportunity to see government spending across the country and within specific filters such as population, ethnicity, and unemployment rates; something no other COVID spending tracker offers!
Before even reading specific details about the COVID spending, the visual design and user experience provides users with a comprehensive summation of spending from coast of the United States.
Map view
As users dig into individual states more and more specific information is opened up, allowing in-depth research aimed at supporting investigative reporters and other researchers interested in county by county data for each state.
Find out where COVID-19 funds were spent.
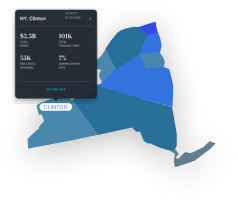
Table view
The table view allows for incontext research based on side-by-side comparisons of data within a specific set of filters, while also allowing users to actually download spreadsheets for offline research as well.

Industry Pages
Users are provided with the ability to look at summary data by specific industries and then within in each state in the country to see how their state may compare to other across the U.S. within critical spending areas like Healthcare.

Tasks, purchase orders, and payments: where the rubber hits the road.
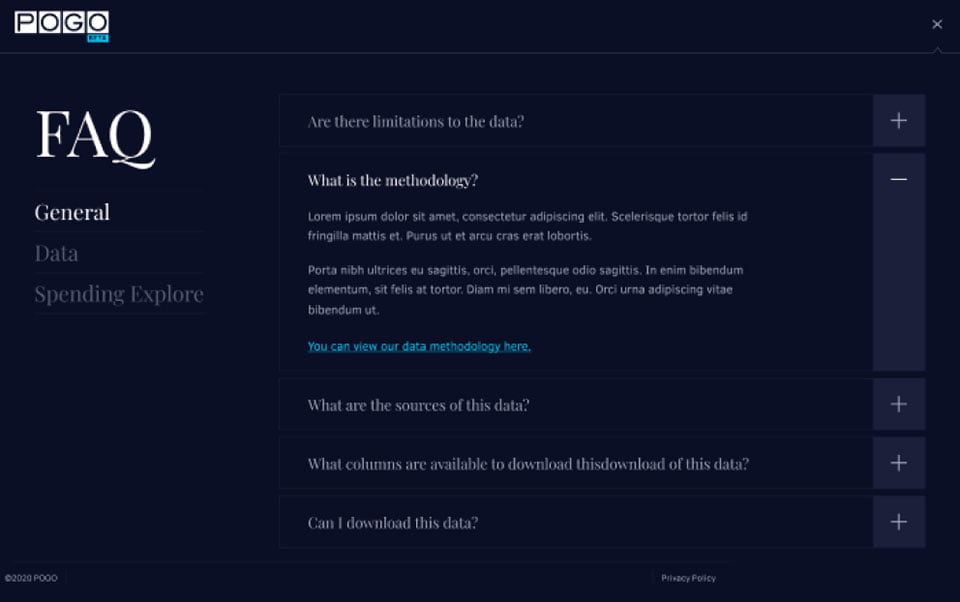
Data Questions
Spending Explorer
Designed by:
Art Direction
George Railean
Project management
Vladimir Bobu
Design
Marcel Sendrea
Lina Ghimp
Do you want to create something similar?
Get a free estimation for your project requirements and start it within 24 hours.
Related Services and Solutions
Don't Listen to Us, Read What Our Clients Are Saying.
We know that trusting an outsider with your vision can be scary. This is why if you're not satisfied with us after the first two weeks, you can walk away owing us nothing.
"We went from prototype to usable software lightening fast, and our customer reviews have never been better."
"Their creativity and mastery of UX UI design has made our years of working together enjoyable and incredibly successful!"
"If you need to re-think your product and need some truly unique design talent , Fuselab Creative design team is your answer."
"We needed a nimble team of UI UX designers to work with our development team and they quickly became one of our most vital resources and far exceeded our expectations."

