studio/ml
Management system for running machine learning models.
Experiments in data science are the basics of success for businesses across the planet. We have entered into a time where data and the testing of data models can be the difference between success and failure for many companies and products.

Problem Statement
Machine Learning needs to be a widely available tool. Data scientists from across the globe need machine learning tools to run models, test their hypothesis and deliver verifiable data. It’s how smart decisions are made and provides a new level of confidence and less guesswork in terms of how products are made, industries managed, and company projections are created.

Goals
studio/ml was developed to minimize the overhead involved with scheduling, running, monitoring and managing artifacts of your machine learning experiments. No one wants to spend their time configuring different machines, setting up dependencies, or playing archeologist to track down previous model artifacts.

Project Screens
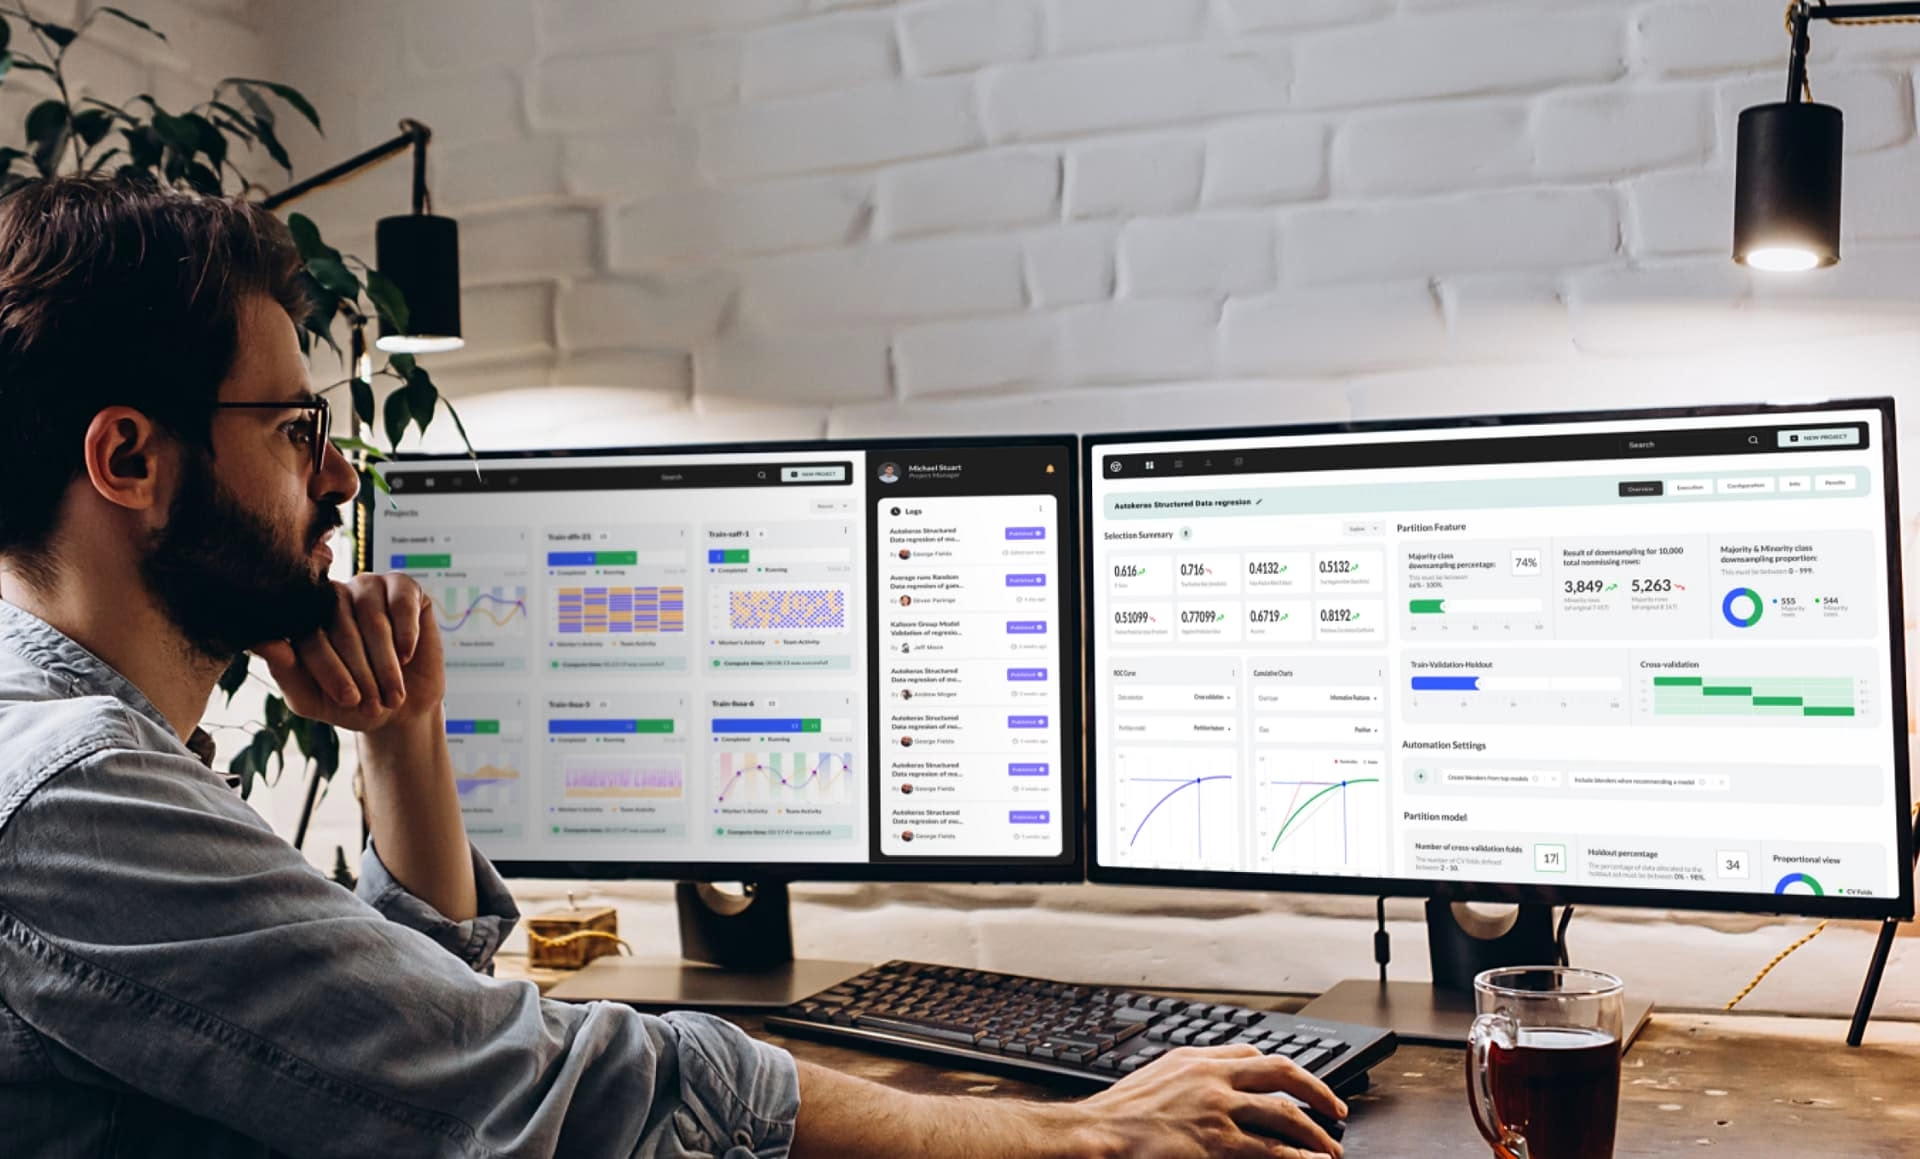
All of your projects in studio/ml dashboard design can be found in one place, along with a set of high-level testing and results data. The user experience here is meant to offer users the ability to quickly scan their projects, the results to-date, and to pick up where they left off in their last session.
Fuselab’s approach to mobile design is quite simple: make every attempt to make everything a user sees clickable and intuitive.

Our app designs should never need some kind of companion explanation or training, instead they should engage the user.

Project
Creation
If you can think it up and have the data ready, the world of machine learning is ready and waiting. As it always the case with Fuselab dashboard designs, we have focused on making everything other than the data itself clickable. The dissolution of traditional menu structures gives way to a truly interactive and responsive experience; and experience this seems to almost anticipate users needs as the each new set of results is delivered.
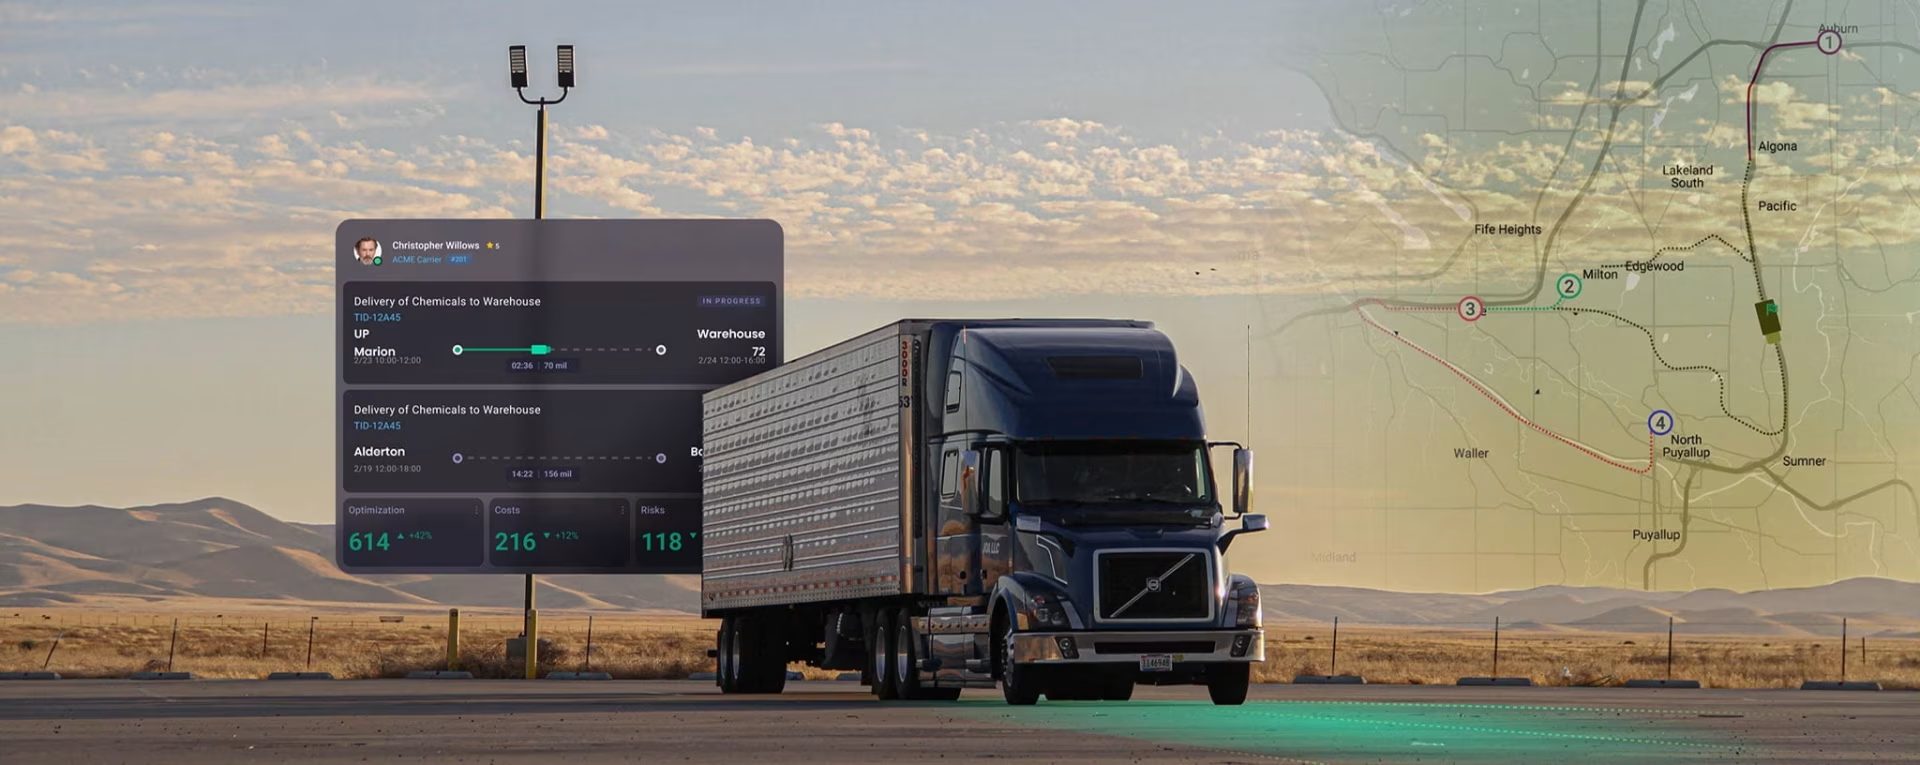
Having access to real time status updates with visible completion graphics makes decision making and visual identification of success and potential problems that much easier.
However, access to information is only part of the goal with our status block feature. It is the progress meters and color-coded animations that set this design apart from so many other similar machine learning platforms.
If you have been curious about how machine learning might help your company’s decision making, but you feel intimidated by all the new jargon and unfamiliar application processes, studio/ml and the effortless user experience designed by Fuselab is a great place to begin your journey.

Prediction
Cross-validation
Data experiments
As mentioned above the company health score can include as many types of activities that an organization may want to include. Each activity is given a distinct color and icon to give users and managers an obvious visual menu to choose. From each type of exercise, user can then drill down in that area to better understand where the score and percentages come from and where there is room for improvement.
Part of each exercise tracking mechanism is the ability to see it’s overall stress level as well as the effectiveness of the exercise over time.

The ability to compare project data and score individual outcomes requires a design team that understands user-centered design strategies. Through our research we were able to determine the most common types of summary data users wanted to see and that it was equally important to have the ability to look at this data within customized filters and as cumulative amounts over time or per class of data.
Fuselab Creative begins every aspect of every interactive design project with a laser focus on user needs and goals. These two aspects guide all of our design decisions, which also creates a rubric for judging the overall success of our design and also what we use to conduct our user testing.


For obvious reasons, data visualization is the foundation of all good machine learning platforms. When working with large amounts of data the only way to make the information manageable and useful is to create visual designs that display patterns, and trends within the data used.
Above you can see examples of colorized data plotting charts showing different learning rates with summary and percentage graphics at the top of each line. Our user interface allows for user to filter different types of views, such as sensitivity and accuracy, and then make further refinements within the interactive sidebar.

Artifact Settings
Features are color coded and set apart in an expanding card-style for simple configuration and experiment tracking and artifact saving.

Each model in our UI design has its own block of code which can be added and used to configure new experiments. The intuitive design allows for easy configuration and the displaying and comparing of results, which can be built upon in further train sessions.

Train Visuals
Our design approach to the project landing page focused on allowing users to view high-level project status, including total project time, team activity, and summary data visuals. Project are also filterable by timeframe and can be found through keyword search as well.

All developed trains produce four common data types, such as precision, accuracy, sensitivity, and loss. Data visualization cards are updated in real-time for live trains, and interactive drill-downs can be performed to view initial trends and clusters of data.
Design System
Fuselab is a UX/UI design system shop above all else. The design system created for studio/ml seen here includes every design element and pixel detailed out in excruciating detail. Every pixel is accounted for in our approach to design systems. Upon completion of our design systems, we are 100% confident that any development team can take our design system and documentation and build the designed application with no questions asked.

Designed by:
Art Direction
George Railean
Project management
Vladimir Bobu
Design
Marcel Sendrea
Lina Ghimp
Do you want to create something similar?
Get a free estimation for your project requirements and start it within 24 hours.
Related Services and Solutions
Don't Listen to Us, Read What Our Clients Are Saying.
We know that trusting an outsider with your vision can be scary. This is why if you're not satisfied with us after the first two weeks, you can walk away owing us nothing.
"We went from prototype to usable software lightening fast, and our customer reviews have never been better."
"Their creativity and mastery of UX UI design has made our years of working together enjoyable and incredibly successful!"
"If you need to re-think your product and need some truly unique design talent , Fuselab Creative design team is your answer."
"We needed a nimble team of UI UX designers to work with our development team and they quickly became one of our most vital resources and far exceeded our expectations."