Dashboard design inspiration: enterprise examples for 2026
Most dashboard design inspiration is the wrong thing to study, because the polished concepts that fill Dribbble and Behance were built to be inpressive in a thumbnail, not to survive daily use. The dashboards actually worth studying are the ones that shipped and stayed in production. Dashboards with extreme data density, role-based permissions, and live feeds are almost impossible to show in a screen shot.
Search for inspiration, and you’ll find thousands of polished concepts on Dribbble, Behance, and Muzli. They’re good for spotting a visual trend and close to useless for judging an enterprise product: how it handles competing metrics or conflicting user roles, and what happens when a data source goes down. What follows are real dashboards we shipped, and the single constraint each one was built to solve.
Where dashboard design inspiration actually comes from
The most useful dashboard design inspiration comes from a shipped product with real users, not a concept gallery. A screenshot captures how an interface looks in one frozen moment. It can’t show whether the dashboard held up once real people used it every day to get actual work done.
The best reference is a dashboard you can find people actually using, and ideally complaining about. Complaints are evidence. They show where a design was tested under conditions no portfolio piece can fake: a slow query, a permission that blocked the wrong person, a chart that misled everyone during a spike.
That evidence lives in specific places. Users file requests for improvements. Product teams publish changelogs that explain why a feature changed. Support tickets expose the workflows people find confusing. An hour on a competitor’s free trial tells you more about its real information hierarchy than a hundred saved Dribbble shots ever will.
This matters more for enterprise dashboards than for consumer apps. A shopping app can optimize for discovery. An enterprise dashboard exists so someone can make an operational decision, sometimes hundreds of times a day, and every chart, filter, and alert on it competes for the attention that decision needs.
Why most dashboards look good but work badly
A dashboard looks good in a mockup and fails in production because the decisions that matter are invisible in a still image. The screen you save to a moodboard shows one state: clean data, no errors, a single user. Everything that decides whether it survives daily use happens outside that frame.
Those hidden decisions are data hierarchy, filter logic, and drill-down, and they don’t carry equal weight. Data hierarchy decides the most. It sets what a user sees in the first two seconds and what waits behind a click, and getting it wrong makes even beautiful charts useless.
Filter logic quietly determines what happens when two roles apply the same filter and expect different results. Drill-down governs how someone moves from a summary to the underlying record. None of this shows up in a rendered frame, which is why a screenshot can look finished and still be half-designed.
When every chart looks equally important, the eye has nowhere to land. Strong dashboards fix this by building hierarchy, not by deleting information: the primary insight reads first, context follows, and deeper analysis stays one interaction away. This is the idea the Nielsen Norman Group has long called progressive disclosure.
In our work with the California Department of Health Care Services, which tracks long-term care data for residents statewide, session recordings showed repeated screen-switching in 70% of enrollment workflows. The redesign reorganized information around the workflow itself, removing the context switching rather than piling on more data.
What the dashboard galleries get wrong (Dribbble, Muzli, Mobbin)
Concept galleries like Dribbble, Muzli, and Mobbin are good for discovering visual trends and wrong for learning how an enterprise dashboard behaves. A concept shot has no live data, so it never shows stale values, role-based permissions, partial loads, conflicting alerts, or a feed that fails mid-session. It shows composition, nothing more.
This is not a knock on galleries. One of our own dashboards, an energy monitor that lets people watch power generation across regions and sources, sits in a Design4Users roundup titled “Dashboard Design Inspiration.” The image traveled well. What the roundup can’t show is the work that made it usable.
That work involved guiding decisions about how to structure multi-source power data into a single legible view: which numbers lead, which sit behind a filter, and how a spike reads at a glance. Copy the layout from the thumbnail, and you inherit the composition but not the reasoning. Galleries track where dashboard design trends are heading, and they can’t tell you whether any of it survives real use.
Enterprise dashboard examples that shipped
The enterprise dashboard examples that teach the most are the ones that shipped and stayed in daily use, because each had to solve a constraint a concept shot never reveals. The constraint is the lesson. The strongest teams started from what users couldn’t do.
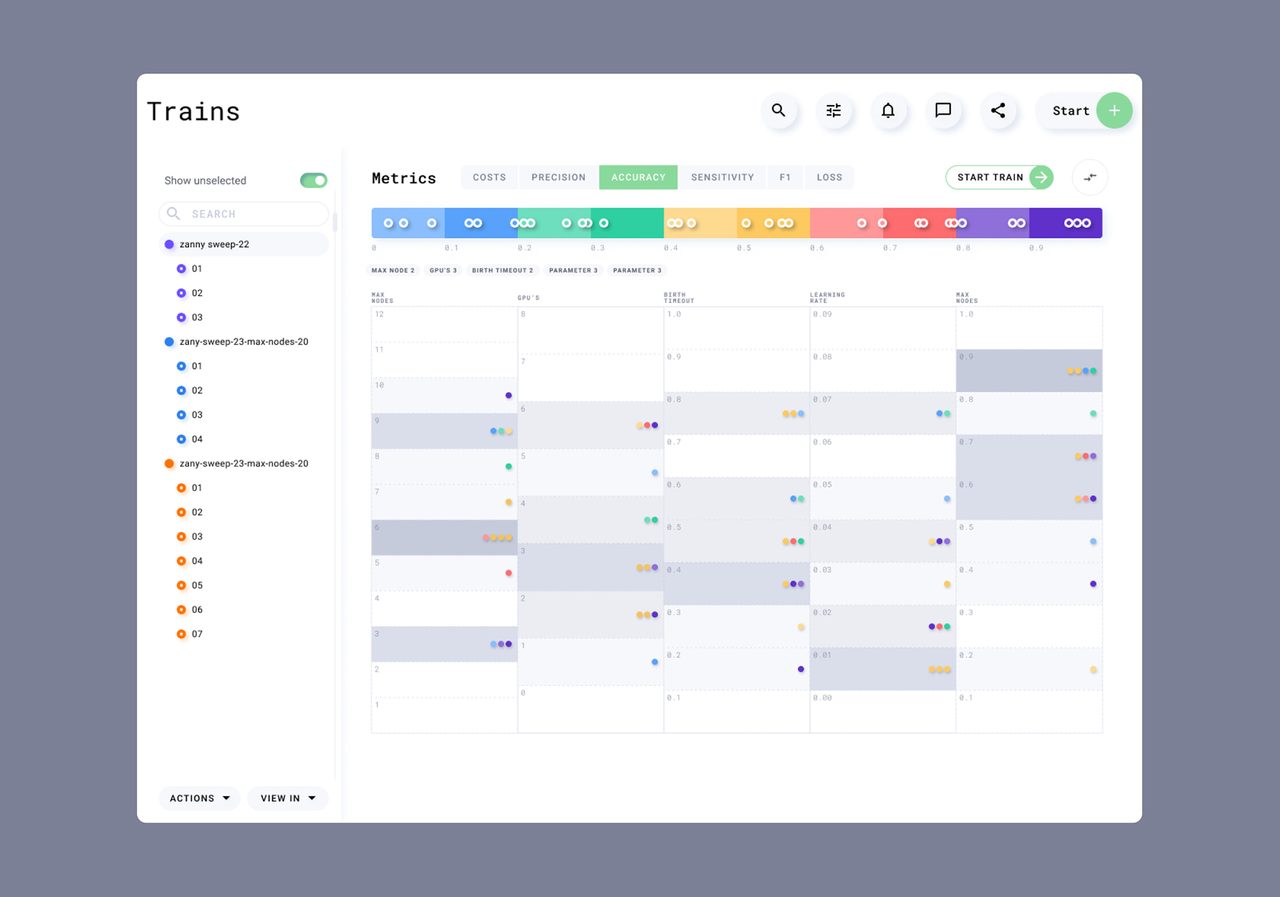
On Grid.ai, now Lightning AI, the constraint was data density. Train, the experiment-tracking product we designed, had to keep a machine learning engineer on one screen for a whole session, tracking runs, monitoring compute costs, and comparing results without switching tools. The team wanted every metric visible because the data mattered.
The shipped version led with the most significant result and kept compute cost persistent across every view, so spending never required a detour to another screen. The real work was protecting an expert’s attention across a long session while still giving them every metric on demand.
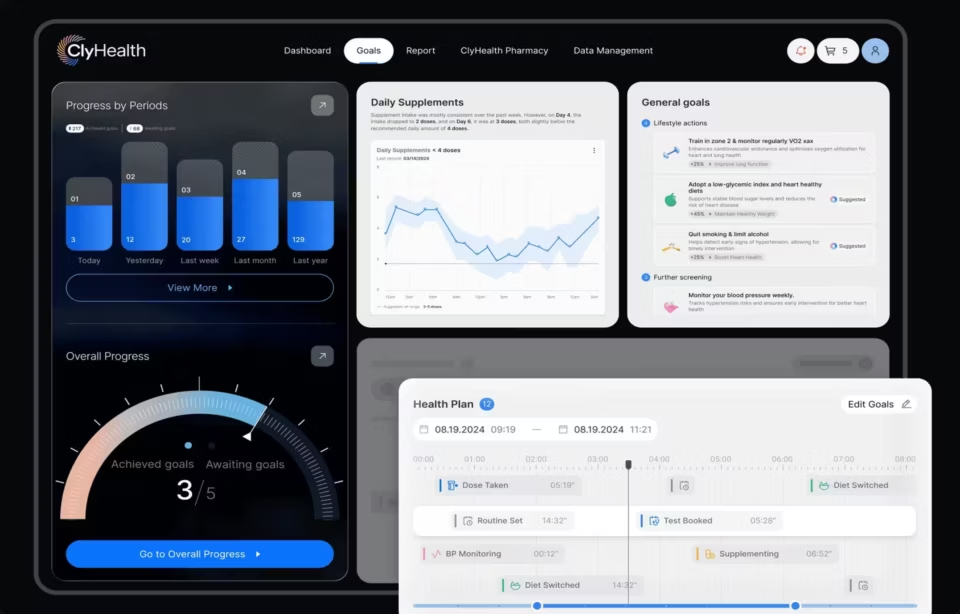
ClyHealth worked under different pressure. Clinicians make decisions where a delay or an extra step has real consequences, and they were quietly ignoring the existing clinical AI dashboard because it showed them everything at once. The redesign started by deciding what the default view could stop showing. Nothing was deleted. It moved one step later in the workflow.
What worked was an interface that revealed information throughout the clinical workflow rather than dumping it onto a single screen. The critical patient indicators read first. Supporting detail appeared only when a clinician needed it, which is how a dense clinical tool stops feeling dense without losing anything a clinician relies on.
Each AI recommendation carried its reasoning, a visible confidence signal, and a one-tap override, so a clinician could see why the system suggested something and reject it without leaving the flow. That combination, less shown by default and more control when it counts, is why adoption recovered.
Automatize is a fleet-operations dashboard built on a live map, and its constraint was density without clutter. A manager needs to see the whole fleet at a glance and the full story of any single truck on demand: location, trip stage, fuel, cost, and mechanical status. Putting all of that on screen at once would bury what matters.
The design kept the live map as the primary layer and pushed details into expandable cards and hover windows opened per vehicle. A manager reads the fleet-wide status first, then drills into a single truck’s trip and cost without losing the map. The map stays the ground truth, and everything granular sits one deliberate interaction away.
X4D is a construction management platform, and its constraint was getting the same project data to people who never share a device. A site worker needs to check today’s task from a phone. A project manager needs to track milestones and reconcile cost codes from a desktop. The same project data has to answer both without either interface carrying the other’s clutter.
The dashboard let each employee use filters, tags, and menus to reconfigure their view to match their role, while a searchable milestone-to-work-package-to-tag hierarchy kept thousands of line items findable without forcing anyone to scroll a flat list. The interface changed by role and was accessible on all devices, while the underlying data structure stayed unified.
Hyperfab ran one product across two interfaces that never share a screen: an augmented-reality layer on goggles for floor operators, and a desktop dashboard for supervisors. Operators need guidance while working next to the robots. Supervisors need to track throughput, station performance, and production targets across the entire facility.
One dashboard stretched to cover both would have failed. The fix was distributing the right information to each context under a single, consistent visual language. This was our first industrial UX project, and the unfamiliarity reinforced the oldest rule in the work: design starts from the job people are doing, not the technology they are using.

Aircraft Bluebook is a study in designing for trust in an editable number. An aircraft valuation is a stack of adjustable assumptions- paint, engine cycles, avionics, modifications- reconciled into one price a lender or lessor will act on. The job is not chart styling. Every assumption behind the number must be visible and adjustable, because a finance team won’t act on a figure it can’t break down.
The Fiserv Small Business Index had the opposite problem. One product served three audiences: a business owner, a sector analyst, and a policy researcher, each of whom wanted their own region’s numbers first, not a national summary they had to click through. The design gave each user type a different default view across three layers: headline figures, sector breakdowns, and state-by-state detail.
Fiserv is a useful counterpoint to ClyHealth and Grid.ai. Those two won by showing less by default. Fiserv had no single default to trim because each role needed something different first. That makes it a relevance problem rather than a restraint problem, and it’s why “simplify” is bad advice when it’s handed down as a rule.
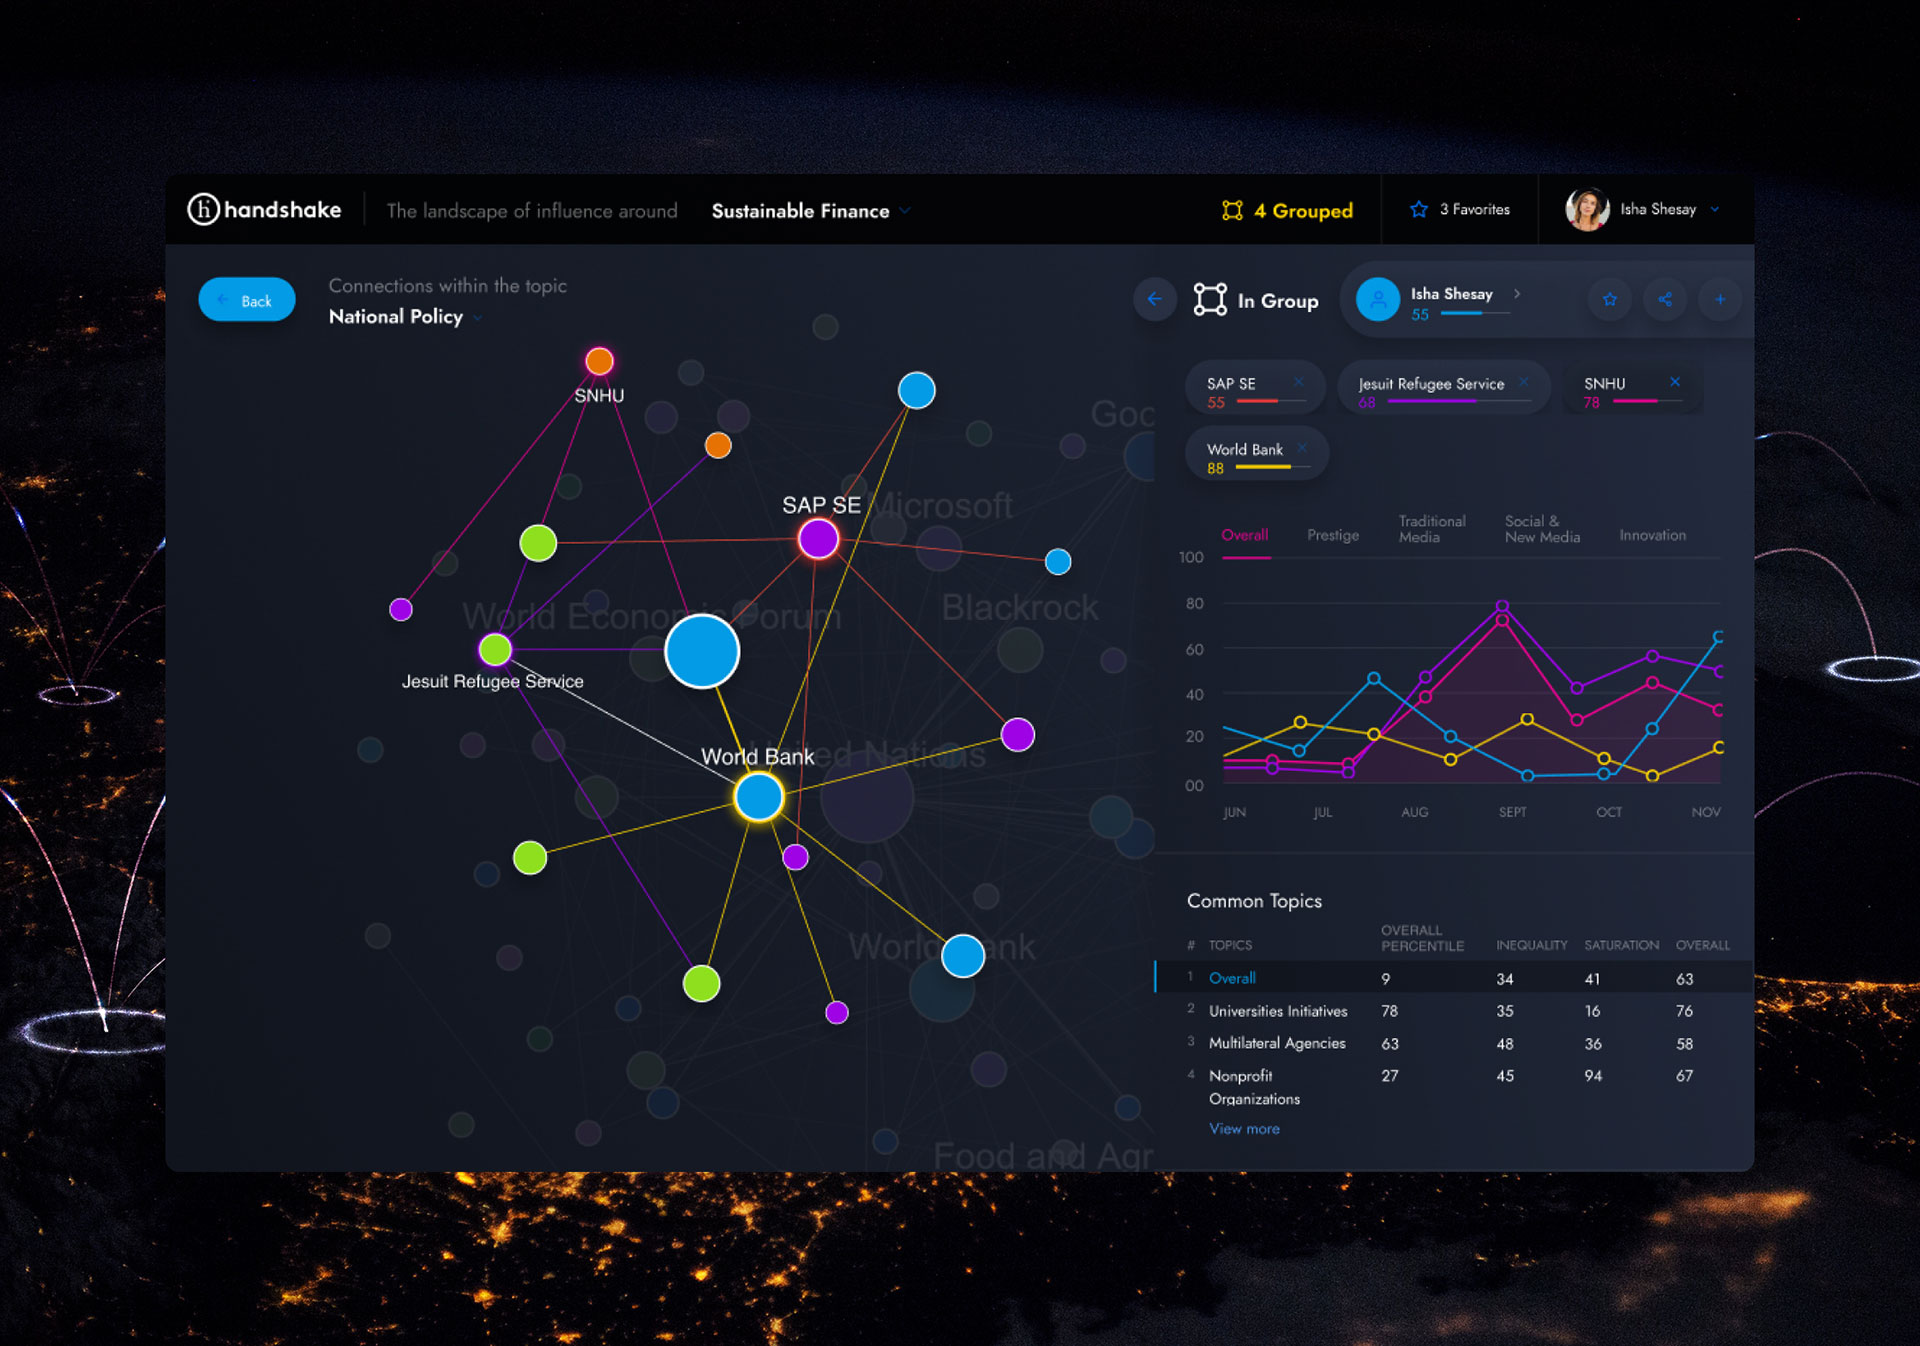
Handshake, built for the World Economic Forum, mapped the influence landscape around emerging sustainable markets. The platform connected a web of businesses, financial institutions, and public-sector actors working on the same issue across geographies and sectors. The constraint was making an ecosystem of relationships legible when the relationships themselves were the data.
The dashboard was organized around topics. Users picked a topic, saw who else was already active inside it, and followed the connections outward to spot where two actors working the same problem hadn’t yet found each other. A comparison view showed where efforts across sectors and geographies were already converging. The map worked like a tool for tracing a network a user couldn’t otherwise see as a whole.
How much can you put on one dashboard before it breaks?
There’s no fixed number. A dashboard breaks when everything on it carries equal visual weight, because nothing tells the user where to look first, second, or third. The fix is hierarchy, not subtraction for its own sake: a dashboard that surfaces an anomaly in two seconds made deliberate choices about what comes first and what waits.
Density itself isn’t the enemy. A manufacturing supervisor watching dozens of robotic stations needs far more on screen than an executive scanning quarterly performance, and neither dashboard is wrong. Each reflects the decisions its users actually make, which is why a universal limit on how much fits has never held up.
So the better question isn’t how many charts fit but which single decision should become obvious inside the user’s first ten seconds. The Interaction Design Foundation frames information dashboards the same way: everything on the screen either supports the user’s task or competes with it. Move, group, or push down any competing elements.
How to turn dashboard design inspiration into a brief
You turn a dashboard you admire into a brief by naming the constraint it was built to solve, not by copying its layout. Start with the problem behind the screen: who it’s for, how often the data changes, and what happens when it fails. The answer to those questions is the brief, not the look. Our design inspiration gallery pairs each screen with the problem it explores.
When a client brings us a dashboard they love, we don’t start with color or layout. We ask what it was built for: an executive reviewing quarterly numbers or an operator reacting to a live incident, because those are different products that happen to share a visual language. If the constraint matches yours, borrow the thinking. If it doesn’t, the resemblance is a trap.
The same screen can be right for one product and wrong for another because the constraint transfers, but the look doesn’t. Once you’ve named the constraint your own dashboard has to solve, you have the actual brief. Our dashboard development process starts with that question, not a moodboard.
Conclusion
The dashboards worth studying are the ones still in daily use long after the demo ended, because they solved a real constraint rather than a visual one. Name the constraint behind an interface you admire before you borrow anything from it, and the next dashboard you brief will work as well as it looks.
Where do designers actually find good dashboard design inspiration?
Good dashboard design inspiration comes from shipped products real people use daily, not concept galleries. Product walkthroughs, change-logs, support forums, user reviews, and detailed case studies show how a dashboard behaves under live data and real roles. A static gallery image shows none of that.
Why do so many dashboards look great but feel useless?
Most attractive dashboards are built to impress in a screenshot, while working dashboards are built to support a decision making. The things that decide whether one works, data hierarchy, filter logic, drill-down, and failure states, only appear once real users and live data hit the product. A mockup hides all of them.
What's the difference between a dashboard mockup and one that actually ships?
A mockup shows a single ideal state with clean data and one user. A shipped dashboard handles live data, permissions, loading and empty states, and requirements that change after launch. Those production realities usually shape the final design more than the original concept did.
Isn't dashboard design just data visualization with a nicer name?
Data visualization and dashboard design aren’t the same discipline. Data visualization turns a dataset into a chart or graphic. Dashboard design wraps visualization inside navigation, filters, permissions, workflows, and business logic so users can complete real tasks, which is why an agency can be strong at one and weak at the other.
How much can you put on one dashboard before it becomes a mess?
One dashboard can hold a great deal as long as the elements aren’t all fighting for attention. It becomes a mess when everything has equal visual weight and the eye has nowhere to land first. The fix is a clear hierarchy set by the user’s main decision, not blanket removal of information.
What makes a dashboard feel obvious instead of overwhelming?
Obvious dashboards answer the user’s main question within the first few seconds. They set a clear visual hierarchy, organize information around the decision the user came to make, and reveal detail progressively instead of showing everything at once. Overwhelming dashboards give every element the same weight.
Can I copy a dashboard design I like from Dribbble?
Copying a Dribbble design rarely produces a working product, because the layout is the part that transfers least. Study the problem the dashboard was built to solve and check whether your users, workflows, and data behave the same way. If they do, borrow the thinking; if they don’t, the design won’t hold up.