How Dashboards Help Create Smart Leadership

Field of Dreams. Pride of the Yankees.
It’s never about the coaches, and it’s rarely about the managers. It’s always about the players.
But, then, Moneyball came out, and it charted the rise of a strategy the General Manager of the Oakland A’s used to get his team out of the pit and into the big leagues.
How to use data and analytics to build a team that traditional scouts missed, at half the cost of the other teams’ budgets.
Everyone gets worked up about the genius of the strategy, but the truth is that Big Data in baseball has been around since the 1800s. It’s why players with specific averages were even picked.
We all missed the real draw (and, no, it’s not Brad Pitt, but you’re close). The real thrill of Moneyball is that one man — and one man alone — had the courage and vision to veer off course, harness an unconventional viewpoint driven by data, and double down after multiple losses — in service of a greater goal.
What’s the moral of the Moneyball triumph?
Big Data can’t make decisions. Leaders make smarter decisions using Big Data.
In this article, you’ll see how the key to cultivating the next generation of leaders is a tool we’re already using, which is evolving alongside leadership’s definition and scope today.
What Effective Leaders Have in Common
Once upon a time, a leader was a messiah with a vision. Then, leaders became generals we could rely on. Soon, leaders transformed into tech innovators. The scope and functions of effective leaders have changed throughout history.
Today’s leaders are operating in an entirely cutting-edge context. Certainly, the characteristics of leaders, such as courage, self-awareness, commitment, and charisma, always hold firm.
However, the scope of leadership in 2020 comes down to five major qualities. Leaders today need to be:
Transparent
Transparent leaders will be able to harness data to back up their decisions and share the source of their smart decision-making with their team.
Risk-takers
Sometimes, data support a particular point of view, but it’s not the best course of action. It’s up to a leader to “go out on a limb” and be risk-takers, going against the grain when necessary.
Innovators
Using data, leaders can see trends and know what moves to make to stay ahead of the curve.
Able to make hard decisions, fast
No matter what, leaders know they can pivot. They’re not attached to their decisions. If something isn’t working, they move on, fast, instead of getting stuck and unwilling to make the next decision.
Able to balance useful data with the company’s overall vision
Data empowers leaders like never before. Suddenly, subjective measurements like gut feelings and even objective arguments of expertise and education are connected to and backed up by data.
While leaders (like Billy Beane) have the courage and vision, data helps them take action (and, at the very least, explain this action to others).
Let Sleeping HIPPOs Lie
Back in 2012 (which feels practically ancient now), the Harvard Business Review covered the rise of a very important managerial phenomenon being debunked. They called it the “HIPPO,” which is a neat little moniker for the “Highest Paid Person’s Opinion.”
Relying on HIPPOs was how we made decisions in a corporate and business setting. However, the rise of data, especially Big Data, changed the way we made decisions, managed the outcomes, and communicated the need for these decisions to team members.
The new culture of decision-making was muting the HIPPOs. Using data to drive decisions, companies were able to consistently reach goals like:
- Improved KPIs
- Trackable incoming metrics about productivity and profit (both of which rose)
- Better customer service and satisfaction
- More personalized customer-facing promotions
Executives interested in using data to drive their decisions need to ask the right questions about the data, including:
- “What does the data tell us about . . . ?”
- “Where did the data come from?”
- “What kind of analyses were conducted?”
- “How confident are we in the results?”
These questions are at the heart of the data visualization techniques to tell a story, gain insights, forecast trends, and more. Leaders can only make thorough decisions that guide the organization along with a vision if they’re smart about what the data spells.
However, what’s clear is that, even in 2012, Harvard’s study on HIPPOs and data-driven decision-making highlighted the need for leadership to truly make that data dance.
“Big data’s power does not erase the need for vision or human insight. On the contrary, we still must have business leaders who can spot a great opportunity, understand how a market is developing, think creatively and propose truly novel offerings, articulate a compelling vision, persuade people to embrace it and work hard to realize it, and deal effectively with customers, employees, stockholders, and other stakeholders.” — “Big Data: The Management Revolution”
How Can Leaders Use Dashboards to Help Businesses Grow
We’re about a decade away from that initial study, and things have ramped up considerably. Data plays a role in almost every single aspect of an organization’s actions and vision.
Today, smart leadership shows up in ineffective dashboards that spearhead a whole range of initiatives — from marketing campaigns to CRM tracking to internal employee engagement.
In 2018, a study of corporate performance by MIT Sloan Management Review found that most executives who use data dashboards are only scraping the tip of the iceberg. They’re using the functions, but they’re failing to harness the full value of dashboard systems.
Michael Schrage, an MIT fellow and co-author of the study, says:
“The most important question a C-level or business unit executive must ask is whether they’re using KPIs to lead and inspire people, or whether KPIs are more about compliance and hitting internal targets. That’s the tension and analytic schizophrenia I’m seeing.”
With these two goals, one micro and one macro, the age of data-driven decision-making requires a different kind of leader. It’s a style of leadership that:
- Enables employees to make good decisions and kick-start their experiments, innovations, and improvements (also known as taking ownership)
- Sets clear KPIs to run useful experiments and then shares the data for future improvements
- Uses data to gain an insight into the systems, resources, and organizational designs that teams need scale operations up
- Creates a culture of intellectual humility that supports the “scientific method” — even leaders can admit, “I don’t know.” But they can use powerful data dashboards to
- Makes data literacy and access to technology part of the everyday, workplace deliverables (through e-learning or ongoing training)
Smart leadership is fluid, porous, and open to new ideas.
But smart leaders also know what they don’t know — and a professional dashboard design can help fill in the holes.

3 Essential Dashboards That Support Smart Leadership
Right now, only 22 percent of employees strongly agree their leaders have a clear direction for their organization.
Data dashboards can change those odds in a very tangible way. Business analytics platforms or financial reporting SaaS tools can help deliver instant, even predictive, intelligence for multiple aspects of growth.
As it turns out, these data dashboards for leadership are called CEO dashboards. They’re specifically used to measure, track, analyze, and visualize data. Interactive data and high-level metrics are not about introducing novelty or maintaining control — rather, it’s about gaining actionable insights.
Each of the following three examples of executive dashboards achieves specific leadership goals, including:
- Increase of business awareness — Whether it’s a support desk team lead or an executive looking to speak to investors more knowledgeably, your data dashboards should give insights across multiple areas of business intelligence
- Enabling of on-the-go decisions — Data is only as good as how easily you can access it. Real-time dashboards should (and do) allow access to insights on the go, regardless of role.
- Providing personalized views — Of course, role-based views are always great. A good leader understands that managers, directors, team members, and other stakeholders each have their KPIs. KPI data visualization is very important for showing your data in real time.
- Allowing flexible reporting — You should also be able to share this data with external and internal partners
- Integrating with other tools and data sources — Regardless of which software platform you choose, data displayed in dashboards should integrate with data from your pre-existing tools, allowing this third-party data to be integrated seamlessly.
Data dashboards fall under three specific categories. Connecting metrics with actions can help leaders completely transform what decisions they’re making and how they make them.
1) Dashboards for Internal Workplace Alignment
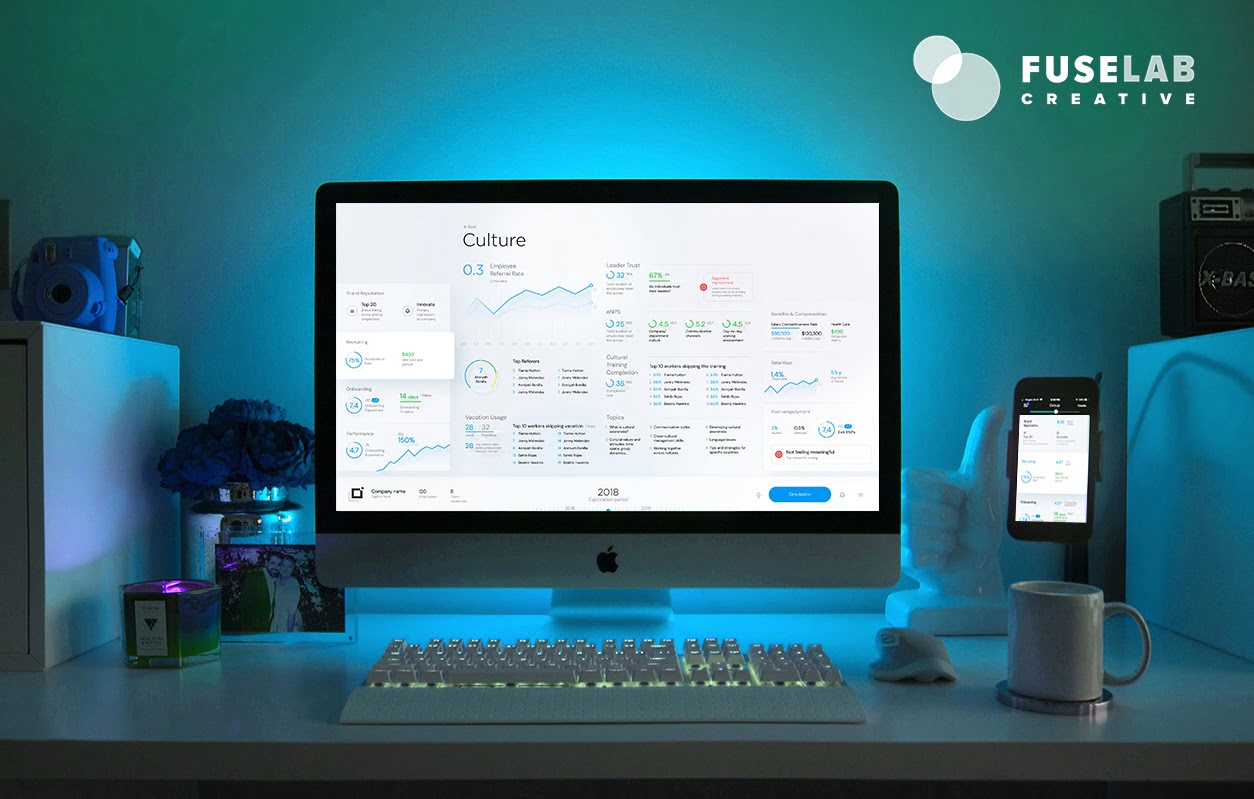
Strategic data dashboards for workplace alignment help to create that transparency we were talking about.
Executive leaders can choose to display these dashboards on larger monitors so all team members can view performance in real time.
With this data, leaders can make decisions around revenue-building activities, return on investment, budgetary maneuvers, current spending, and more.
2) Analytical Dashboards for Improvement Over Time
While strategic dashboards can help leaders make clear financial decisions, analytical dashboards help them get predictive and incisive.
Analytical data dashboards not only consolidate insights, they also help you track trends over time through reporting.
Not only can you visualize important trends, but you can also forecast them. Analytical dashboards can help you spot things that are going wrong — and keep doing what’s working.
3) Operational Dashboards for Daily Business Processes
With one eye on the macro, leaders also need to focus on the everyday details or the micro.
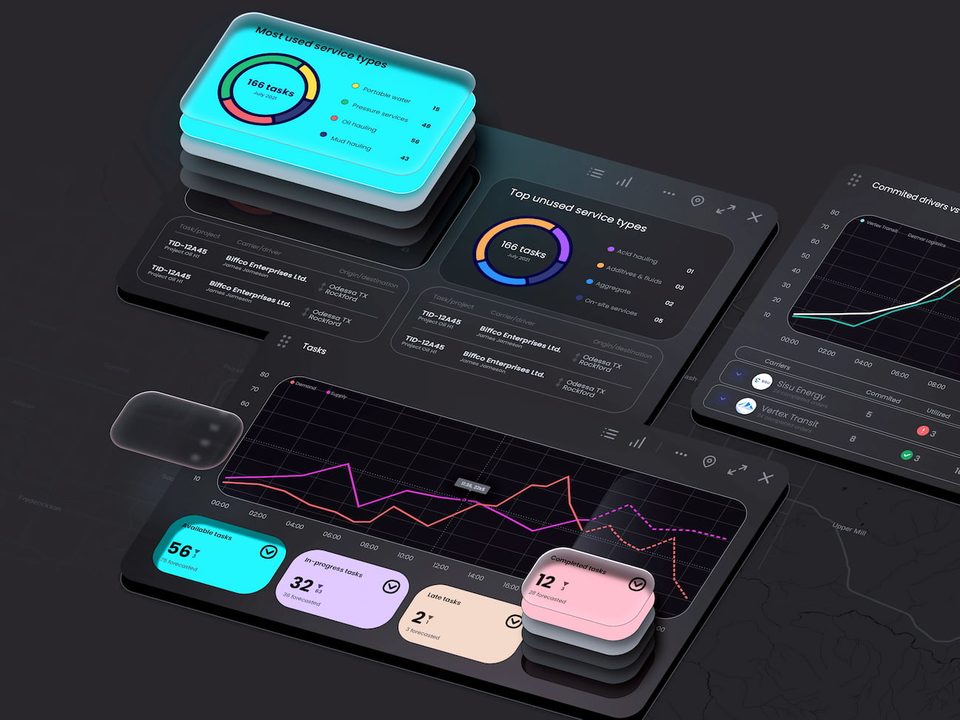
That’s where operational dashboards come in. These dashboards hook the broader objectives of the business into the task-by-task details of the company.
Operational dashboards are the most accessible, which is why smart leaders will create an environment where individuals can identify immediate actions, exchange key learnings, and zero in on areas for performance improvements.
Examples of operational dashboards for smarter leadership include:
- HR data dashboards — Tracking projects, timelines, hiring statuses, and onboarding procedures
- Project management dashboards — Tracking project statuses, tasks, resources, workflow, and more
- Sales pipeline dashboard — Tracking contacts with customers, deal status, and sales pipeline activity
The pressure is off on leaders to “know it all” Phew. Instead, today’s smart leadership practices are all about connection, transparency, and accountability. The good news is that data dashboards are designed with precisely these principles in mind. And if they are leaders with actionable insights into making better, more aligned decisions to support the collective vision — all the better.
Our dashboard design agency can help you find the best solutions for your needs.


