EffiTrack
EffiTrack delivers a seamless exploration of energy data visualization. Navigate from a comprehensive global perspective to granular building-level details, unlocking hidden patterns and opportunities for energy savings at every level. With its intuitive interface, interactive real-time data visualizations, and multi-layered analysis, EffiTrack enables users to understand consumption
Our scalable design for this platform offers a clear view of energy dynamics at global, regional, and local levels, culminating in precise analytics all the way down to selected buildings to help drive sustainability and cost efficiency. See case study below for detailed information.
Project Overview
EffiTrack was developed to be one of the most advanced energy monitoring dashboard systems on the market. Each screen helps users to use this data visualization platform to view, monitor, and analyze energy consumption across multiple metrics. From global trends to individual building performance, EffiTrack empowers decision-makers with actionable insights to optimize energy efficiency and sustainability.


Goals
Everyone is very aware of the impact energy systems, such as coal-fired power plants pose on our sustainability and the global impact on our environment. Understanding how to manage our current systems and add-on systems to reduce their impact while maximizing their output is balancing act. This is where systems like EffiTrack come in, and make of these questions a lot easier to answer.

Strategy
Our UX/UI strategy focused on creating a platform where the grouping and documentation of experiments was paramount in our approach, making the immediate usability 100% intuitive. Not everyone in this space likes to work the same way, but with amount of customization features offered we created a much less rigid framework than most techs are used to.
Powering the Globe: A Holistic Overview
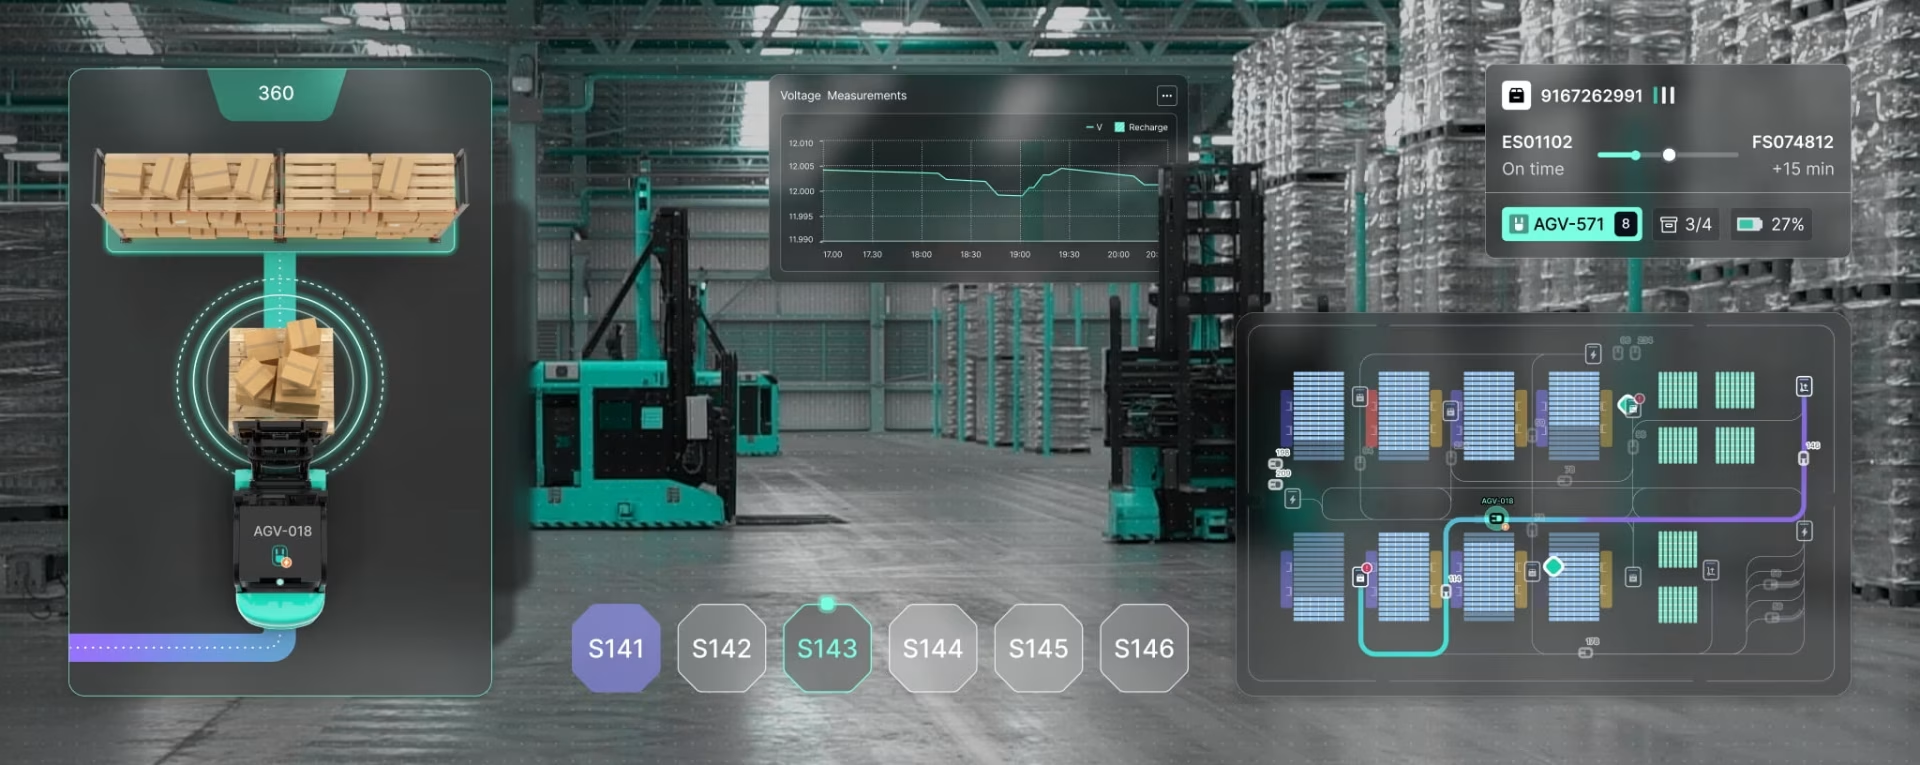
Explore the nuances of energy usage at the area level. Mapping Energy: Area Analysis provides interactive visualizations and key metrics to identify hotspots, compare regions, and assess the efficiency of energy distribution through data visualization for energy networks.


Mapping Energy
Area Analysis
Gain localized insights into energy consumption patterns and resource distribution with Mapping Energy: Area Analysis. This module highlights area-specific dynamics, revealing urban and rural trends, infrastructure impacts, and opportunities for optimizing energy use. By zooming into specific regions, users can make informed decisions tailored to local energy needs through efficiency data visualizations delivered in real-time!

Exploring
Nationwide
Connections
Explore the diverse landscape of renewable energy with our Power Spectrum screen. Delve into the unique characteristics of hydro, wind, solar, and bioenergy, understanding their roles in driving sustainability and transforming the global energy mix.
Interactive visuals showcase how these energy sources contribute to global decarbonization goals, and countries, states, and municipalities join forces in creating a more sustainable future for us all.


Time is possibly the most important factor to understand during a storm. It is the passing of time that changes everything for those making decisions during a disaster, and knowing ahead of time what to do and what to expect can save lives.
Everyone wants to know what to expect and how bad it will get during a storm. Flood impact is one of the few tools that can actually provide answers to these questions before a storm every makes landfall.
Depending on your role and what kind of storm is headed your way, you may be much more interested in wind speed versus rainfall, regardless all the presets you will ever need are here with Flood Impact.
The Power
Spectrum: Hydro,
Wind, Solar & Bio
Explore the diverse landscape of renewable energy with The Power Spectrum. Delve into the unique characteristics of hydro, wind, solar, and bioenergy, understanding their roles, capacity to deliver, and how these energy sources can best be tapped to drive sustainability and transform the global energy mix for the better. The interactive visuals below showcase how these energy sources can positively contribute to our global decarbonization goals.


Visualize the flow of energy from hydroelectric plants, showcasing output efficiency, reservoir levels, and the crucially important seasonal variations.
Analyze wind energy generation trends, turbine performance, downtime for maintenance, and the impact of weather conditions on output.
Analyze wind energy generation trends, capacity levels, trends based on historical data, turbine performance, and the impact of weather conditions on output.

Dynamic Factors:
Simulating Energy
Scenarios
No one likes to be caught in a storm. Understand the interplay of key energy parameters like demand, climate, and demographics with Dynamic Factors. Through simulations, uncover potential risks such as automotive and pedestrian area flooding and explore scenarios that guide smarter energy decisions and sustainable planning. These insights only help anticipate challenges and develop adaptive strategies, it is exactly this kind of data visualization that can saves lives and provide for a more equitable and sustainable future at home and across the globe.

Designed by:
Art Direction
George Railean
Project management
Vladimir Bobu
Design
Lina Ghimp, Vitalie Ghimciuc
Do you want to create something similar?
Get a free estimation for your project requirements and start it within 24 hours.
Related Services and Solutions
Don't Listen to Us, Read What Our Clients Are Saying.
We know that trusting an outsider with your vision can be scary. This is why if you're not satisfied with us after the first two weeks, you can walk away owing us nothing.
"We went from prototype to usable software lightening fast, and our customer reviews have never been better."
"Their creativity and mastery of UX UI design has made our years of working together enjoyable and incredibly successful!"
"If you need to re-think your product and need some truly unique design talent , Fuselab Creative design team is your answer."
"We needed a nimble team of UI UX designers to work with our development team and they quickly became one of our most vital resources and far exceeded our expectations."