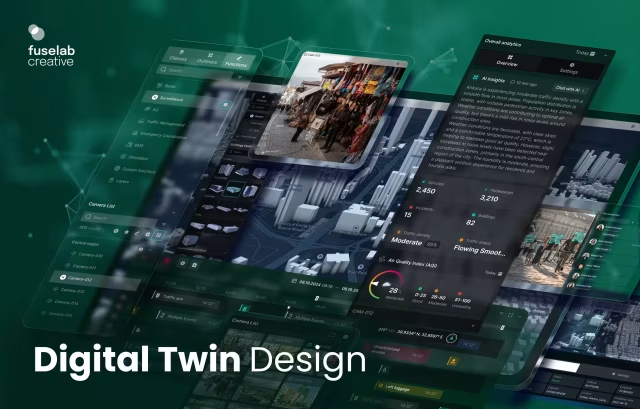
Fuselab provides digital twin services that design the interface your team uses to run a live twin: the dashboards, control centers, 3D views, and prediction screens that turn data into unique insights that lead to cost saving, time saving, and in some cases, life saving decisions.
What we do
The interface layer of your digital twin: the control center, monitoring dashboards, 3D and map views, and predicted-state screens, designed and prototyped on your simulation and sensor data. We focus on the layer people actually use, not the modeling engine underneath. We have always been committed to the business of staying in our lane.


Most engagements start with a prototype of the one screen your team cannot live without, tested with real users before any model is wired in. From there we design the rest of the interface starting with the most critically needed screens first, working alongside the owners of your data and simulation requirements. You see a working prototyped screen early, not a deck.
A clickable prototype of your core screens, a design system the engineering team can work from, and the dashboards, control center, and prediction views ready for development. Everything is designed using your existing data, so what you test is what your operators will actually use, not a mockup that breaks under live conditions.

What we design inside a digital twin

The control center is the single screen an operator watches to hold the whole twin in view, often hundreds or thousands of assets reporting at once. The design problem is hierarchy: deciding what sits at the top level, what stays one click away, and how a single asset going wrong pulls focus without burying everything else. We design the layout, the state indicators, and the alerting so the one thing that needs human engagement surfaces before anyone has to go looking for it.


Manufacturing and infrastructure twins pull in terabytes in minutes, and most of that data is a person scrolling past noise to find the one number that matters. We design the dashboards that turn that volume into a few readable graphics, so a bottleneck, a drift in performance, or a machine about to fail shows up early instead of after it has already stopped the line. The work is deciding what to show, what to summarize, and what to hide until it’s needed. This is a delicate balance that requires a team of humble experts.


For city blocks, buildings, pipelines, and distribution networks, the twin only makes sense seen in space. We design and integrate the 3D models, map layers, and animation that let a user move through that space and still read it while it updates live. The hard part is keeping a spatial view legible under real conditions, with numerous lighting and sound challenges, and when hundreds of moving elements are changing at once and the operator still has to find the one that matters.


The predicted-state screen is where the model shows what it expects to happen next, and it is the screen most likely to be ignored if it gets the design wrong. We prototype and test these with real users before any AI is wired in, because a prediction no one can read, or one that hides how confident it is, is a prediction no one acts on and eventually ignores. Designing how certainty and uncertainty are shown is as important as the forecast itself.


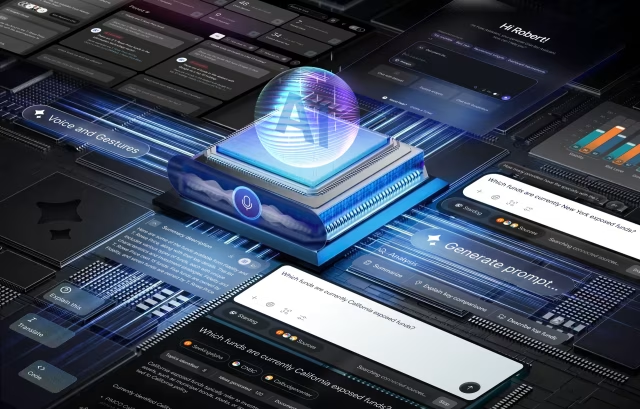
The chat layer lets someone query the twin in plain language and receive an alert as a message rather than a wall of telemetry. We design it so a grid operator can ask what changed at 2am and get a straight answer with back up data to help provide confidence. This is about building a system that knows when to interrupt a person and when to stay quiet. Done well, it becomes the way most people actually use the twin, without ever opening a dashboard.

Digital twin services by industry

In healthcare the twin is only as useful as the screen a clinician reads between patients. The design problem is dense, multi-source patient data that has to resolve into one clear decision without cognitive overload. That constraint, not the modeling, usually decides whether clinicians keep using it.

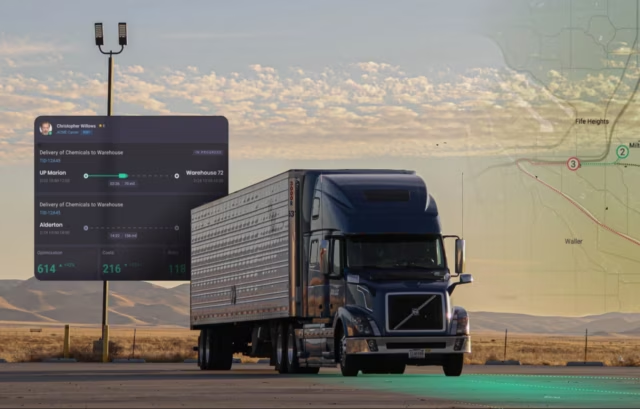
Supply chain twins fail when the operator cannot see the one disruption that matters inside a network of thousands of moving parts. The interface job is to make a weather delay, a demand spike, or a supplier failure legible the moment it appears, not buried three screens deep across warehouses and transport.

In energy the audience is a grid operator deciding at 2am whether a fluctuation is noise or the start of an outage. We design the alerting and prediction interface: a view showing performance in real-time, flagging the failure pattern early, which enables the system to surface that alert as a plain message rather than a wall of telemetry.

In construction the twin spans the whole life of a building, from clash detection during design to facility management after handover, and each phase hands the screen to a different user. The design work is keeping one interface coherent as the audience shifts from an architect checking a model to a facilities manager years later.

In automotive the twin follows a vehicle from engineering simulation through the production line to the cars already on the road sending data back. The interface problem is scale and audience: an engineer testing thousands of parameters and a fleet manager watching live vehicles need very different views of the same twin.

A manufacturing twin can pull terabytes off the factory floor in minutes. The design question is what an operator sees first: which line, which bottleneck, which machine is about to fail, surfaced before it stops production rather than after. We design the monitoring view and the chat interface that lets an expert diagnose a line remotely.
DMF: the full digital twin builder we designed
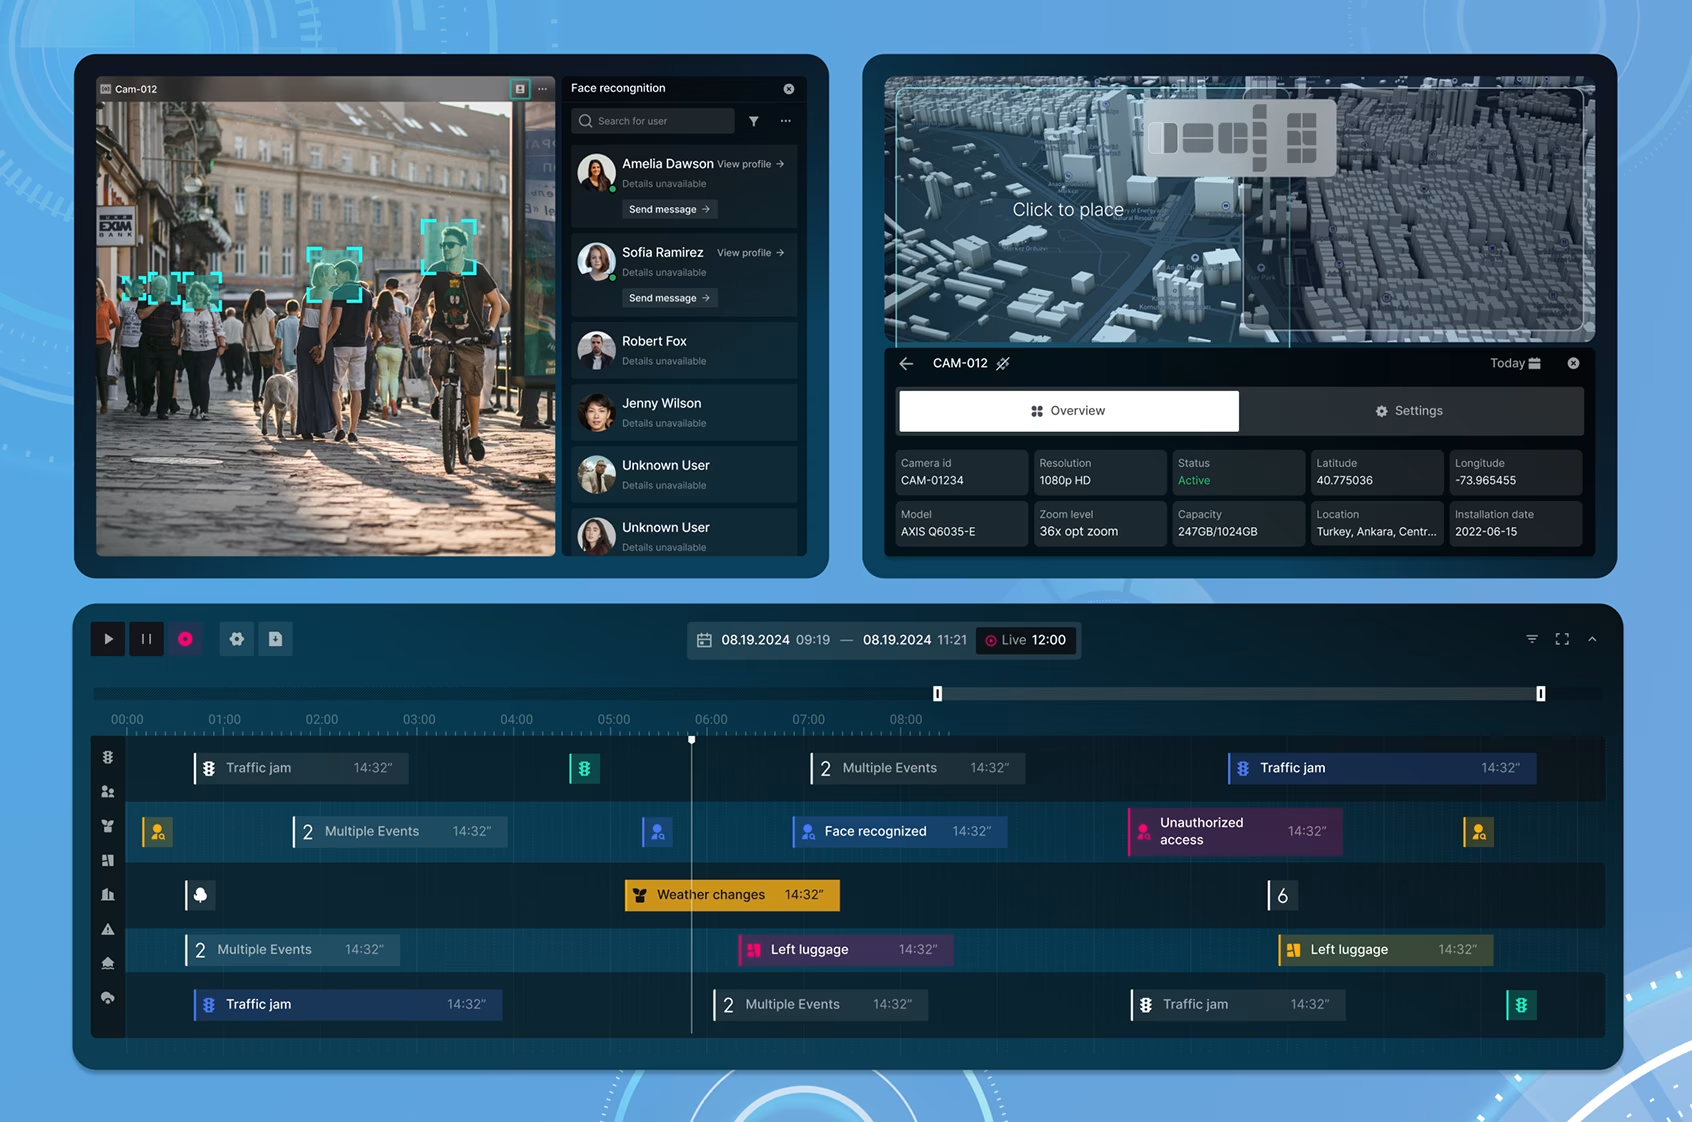
DMF is a full digital twin builder we designed: one interface spanning smart cities, manufacturing and logistics, construction, and oil and gas, where a team assembles a twin and watches it run. Its timeline lets a user move precisely through recorded history, with event tracking built for security review.

Full Digital Twin Builder
The core environment, where a user assembles a twin from data sources and watches it run live, without a separate tool per industry.

AI chat inside the twin
A conversational layer that lets an operator ask what has changed, what is predicted to change, and all of this info is delivered as a plain message and not something in need of deciphering.

One builder, every sector
The same environment configured for smart cities, manufacturing and logistics, construction, and oil and gas, each sector inheriting the same controls and getting only the views its users need.

Lets a user move precisely through recorded history, with event tracking and analysis built for security review.


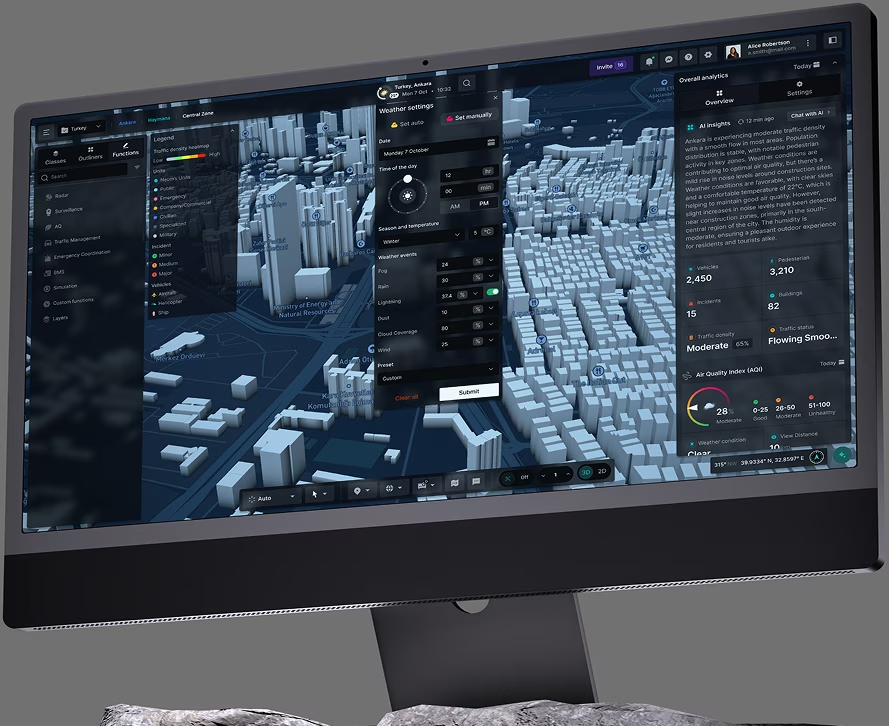
A city twin has to show a 3D model, live metrics, controls, and an AI assistant at the same time. DMF is where we worked out that layout: each element readable, none of them fighting for the same space, the 3D scene still navigable while the numbers update live.
Selected work
DMF, the Automatize logistics platform, and RhythmX AI are among the digital twin and data-interface projects we have designed. See our work
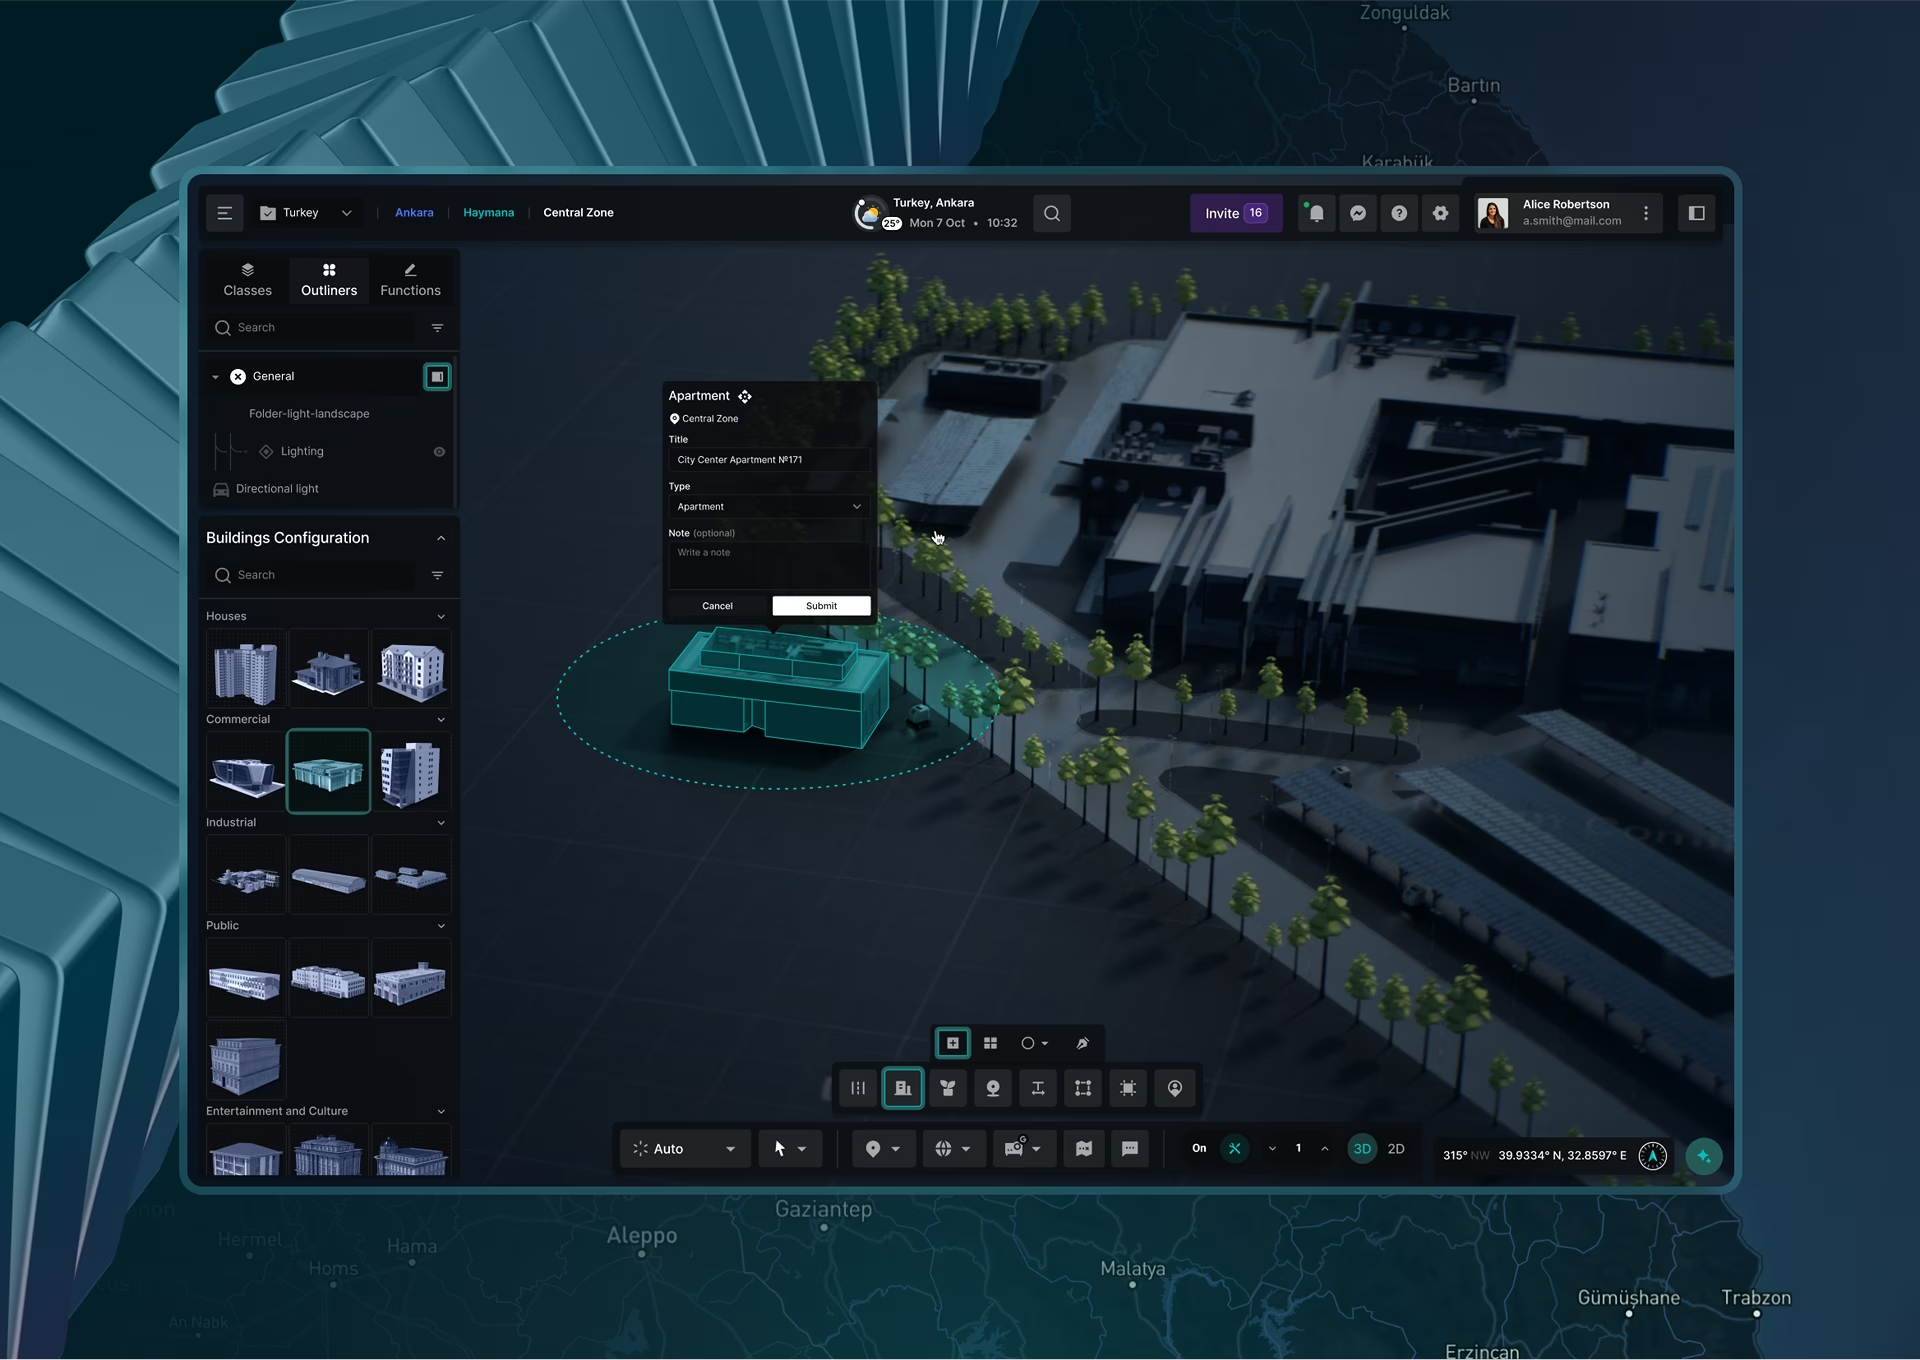
The 3D city view
DMF renders a live city as a navigable 3D model with traffic density, air quality, and emergency layers laid on top. A planner can move through the model while the data updates around them, so the spatial view and the live metrics stay readable at the same time instead of competing for the screen.
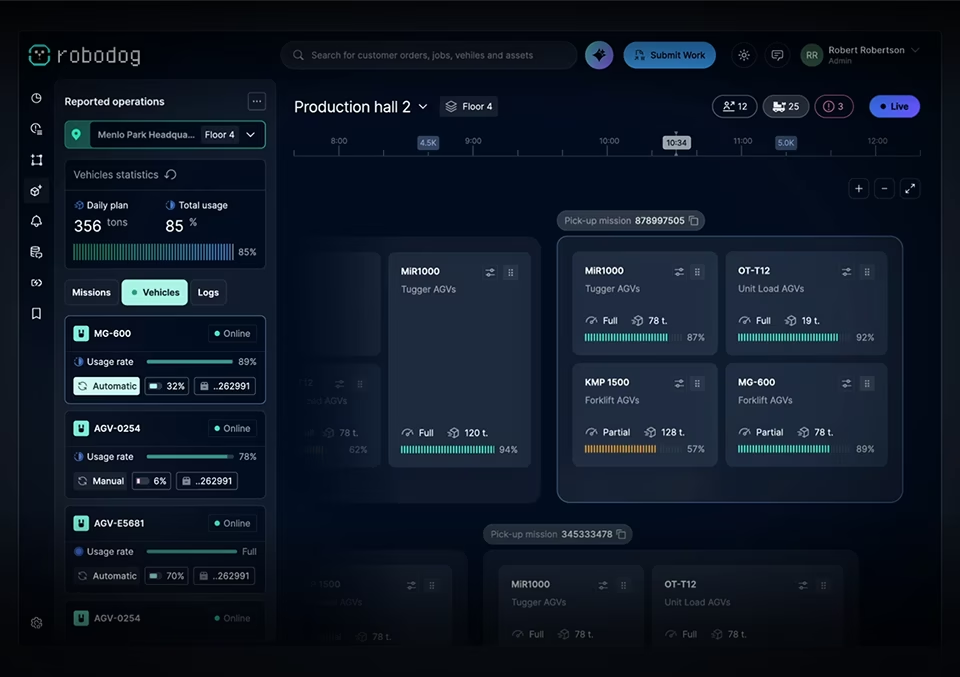
The control center
The control center holds live state across every asset in the twin on one screen, which can mean hundreds or thousands of feeds at once. We design the hierarchy and alerting so the one thing that needs attention surfaces first, and an operator is never scrolling to find the problem that already started.

The timeline
The timeline lets a user move precisely through everything the twin recorded, rewinding to the exact moment something changed. Event tracking and analysis are built in for security review, so an incident can be reconstructed step by step rather than pieced together from separate logs after the fact.

The AI panel
The AI panel lets someone ask the twin a question in plain language and get an answer drawn from live data, without opening a single dashboard. We design it to point straight to the screen or asset behind the answer, so a question turns into action instead of just another readout.

Predictive view
The predictive view shows what the twin expects next, not only its current state, with a forecast laid over the live data. It also shows how confident the model is, because a prediction with no read on its own certainty is one an operator cannot safely act on, and that signal is as much a design decision as the forecast itself.
Related Services and Solutions


Frequently Asked
Questions
What do Fuselab's digital twin services include?
Fuselab’s digital twin services cover the interface layer of a twin: the control center, monitoring dashboards, 3D and map views, predicted-state screens, and the chat interface a person uses to query the twin in plain language. We design and prototype those screens on top of your existing simulation and sensor data. The modeling engine and data pipeline stay with your team or your platform vendor.
What part of a digital twin does Fuselab design?
Fuselab designs the human-facing layer of a digital twin and leaves the modeling engine and data pipeline to whoever owns them. In practice that means the control center, the monitoring dashboards, the 3D or map view, and the predicted-state screen, all built on your live data. The scope is deliberate, because the interface is where most twins lose their users.
How is a digital twin design agency different from a platform vendor or consultancy?
A digital twin design agency designs the screens people use to read and act on a twin, while a platform vendor builds the engine that runs it and a consultancy advises on strategy and data. The three are complementary. Fuselab often designs the interface that sits on top of a platform a client has already bought or a model a consultancy has scoped.
Is digital twin design the same as digital twin development?
Digital twin design and digital twin development are different stages. Design is the interface work: prototyping and shaping the screens, the alert logic, and the way data and predictions are shown. Development is building the underlying twin, the data integration, and the model, which Fuselab does not do, working instead alongside the team or vendor that owns it.
How does a digital twin design engagement start, and how soon do we see something?
A digital twin design engagement usually starts with discovery and a prototype of the single screen your team cannot work without, tested with real users before any model is wired in. That working prototype typically comes in the first weeks, not after a long build, so you can judge the direction early. From there we design the remaining screens in the order your users need them.
How much does a digital twin interface project cost?
A digital twin interface project is priced by scope: the number of screens, how many user roles each must serve, whether a full design system is included, and whether the work is a prototype or a complete build through development handoff. A prototype-first engagement is the lower-commitment way to start, and it proves the direction before the larger investment. For a current rate and minimum project size, our Clutch profile is the place to check.
What does Fuselab need from our team to begin?
Fuselab needs three things to begin: the data schema your twin produces, the user roles who will read the screens, and access to your simulation or sensor outputs. With those in hand the design work starts on the screens that matter most. We do not need to own or rebuild your twin to design the layer on top of it.
Start with one screen
Tell us what your twin needs to show and to whom. The fastest way to begin is a prototype of the one screen your users cannot do without.
More on digital twins and interface design
Fuselab Creative Insights