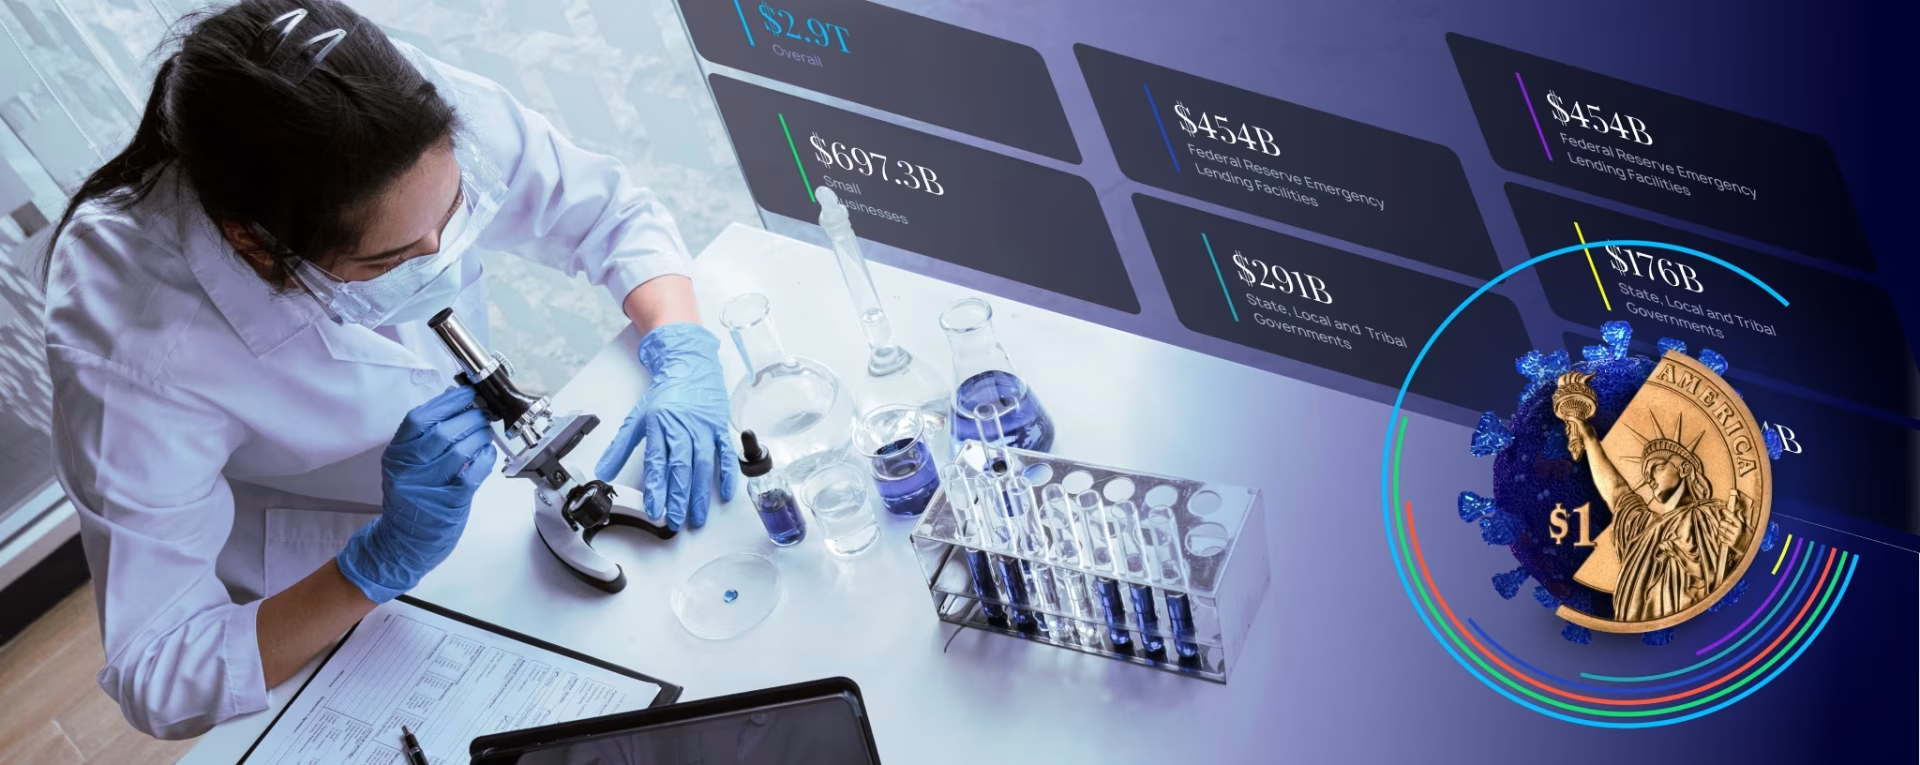
Control Ai

Services:

AI & ML, Technology

Description:

AI application for monitoring public reaction and understanding the connections to new laws, policies, and events.

Control AI is helping users gain insights from AI data through multi-level network graphs and personalized navigation and search.

Introduction

AI-Powered Event Monitoring 
and Timeline Tracking

Discover connections between entities, communities, and agents in real-time
Wondering about the latest public reaction to an event, political speech or law passage; Control AI can help you dig deep into public sentiment, related subjects and the initial list of those impacted.
Finding the connections and gaps in a new law or policy can be hard to discover, however, with the personalized filtering and interactive data visualization this kind understanding and insight is only a few clicks away.

1

Event Insights

Real-time visibility into key events, trends, and governmental actions.

2

Network Heatmap

Spatial view highlighting activity, related subjects and organizations and what others are saying.

3

Zoomed Diagnostics

Drill into specific connection points to understand those impacted and how they relate to each other, along with detailed analysis.

4

Sub-levels of Data

Travel as far down the rabbit hole as you like to discover all the unique connections between thought, people, places, and organizations.

5

Follow Specific Law Changes

The development of new laws and changes to existing laws impacts people and regions differently. User can easily see those impacted and at specific levels.

Telemetry

Generative Data Visualizations Based on Network Interactivity

Users can pre-set areas of interest and follow new interactions, levels of positive, negative and neutral public sentiment, along with total engagement levels. Choose your notification levels and total platform engagement and then sit back and watch as unique insights and new connections are formed across the platform, exposing users to unexpected revelations.

KPI-Heavy

Complete KPI & Analytics Breakdown

Set your own key performance indicators and data analytics areas and watch our network graph evolve over time and across events. Imagine you are managing a political campaign and you are interested in better understanding how your constituents are feeling about a recent speech by your candidate. This is where a too like Control AI and a new level of deep interactivity can be a game-changer.

Monitoring

Follow Specific Insights for a Full Picture of Your Interconnections

The insights become the central structures of which all information is organized. Each of the individual attributes of a connection present a large network to examine and learn from. Summary-level graphics offer up scannable quick views of critical data points and the legal relationships for each.

99.9%

Network Availability

Ensures uninterrupted connectivity across events.

+42%

Operational Response Speed

Faster issue detection and resolution through real-time diagnostics and alerts.

1.2M+

Connected Devices Monitored

Tracks Wi-Fi and 5G device activity to optimize performance and attendee experience.

Resilience

Constitutional Constellation Graph

Our dominant visual in the graph below is a force-directed galaxy graph centered on the Constitution node (47%), with major policy domains radiating outward as labeled cluster hubs — Government Affairs (31%), Energy & Transport (38%), Culture and Media (22%), Justice and Judiciary (13%), Healthcare (11%), Education (25%), Family and Community (33%), Environment (17%), Sport (24%), and Security (23%). Each hub then branches further into smaller entity and legislation nodes, color-coded by type. The gold radial lines connecting the Constitution to each domain carry real visual weight, communicating hierarchy and legal primacy effectively.

Experience Enhancement

The platform provides actionable insights understand events from multiple perspectives in one view.

Summary Metrics Panel

Easy to view metrics, including services, entities, related laws, and KPIs

Detail Card

Drill down into individual detail cards for stats on individual regulations.

RI Analysis

Regulatory analysis provides insight and recommendations for proposed de-regulation

Dynamics

Regulatory Intelligence

Our RI (Regulatory Intelligence) Analysis module/chat window, allows for mid-experience research and new connections to be made in the network/constellation. Paired with the conversational “Ask a question…” prompt bar and the “My agent +3” selector, this section positions the platform as an AI-augmented policy advisor — not just a visualization tool, but an active analytical partner.

We are a SaaS design
company that sticks
to our principles

<span class="highlighted"><small>Users don't come first</small></span><br>Business Comes

Users don't come first
Business Comes

That doesn’t mean ignoring users. Every business benefits from understanding its users and improving the product for them. Being user-centered is valuable — but it’s valuable because it drives business success.

<span class="highlighted"><small>Structure is key</small></span><br>But Good UI Matters

Structure is key
But Good UI Matters

That doesn’t mean ignoring users. Every business benefits from understanding its users and improving the product for them. Being user-centered is valuable — but it’s valuable because it drives business success.

<span class="highlighted"><small>Design is a process</small></span><br>Not An Event

Design is a process
Not An Event

There’s no place for overnight success. We work in short iterations, moving to the result bit by bit, and expect your consistent feedback.

Ready to work with us?

Contact Us

Featured projects

More data-visualisation work for the public sector and other complex, high-stakes domains.