Warehouse robotics fleet dashboard design in 2026

Warehouse robotics fleet dashboard design is the supervisor-facing discipline of building interfaces that consolidate live operational data from automated guided vehicles, autonomous mobile robots, and mixed fleets into a single view designed around what warehouse supervisors actually decide during a shift. The category only got named once warehouses started running two or three vendors in parallel, and the vendor-supplied dashboards stopped working as a coordination layer, leaving supervisors running peak-hour operations from radios while the screens behind them went unread.
What is warehouse robotics fleet dashboard design?
In practice, warehouse robotics fleet dashboard design produces supervisor interfaces that consolidate fleet position, exception alerts, throughput metrics, and recovery workflows for warehouses operating fleets of automated guided vehicles, autonomous mobile robots, or both. The layout is shaped by what supervisors decide during shift transitions and peak-volume operations, not by what each vendor’s API exposes.
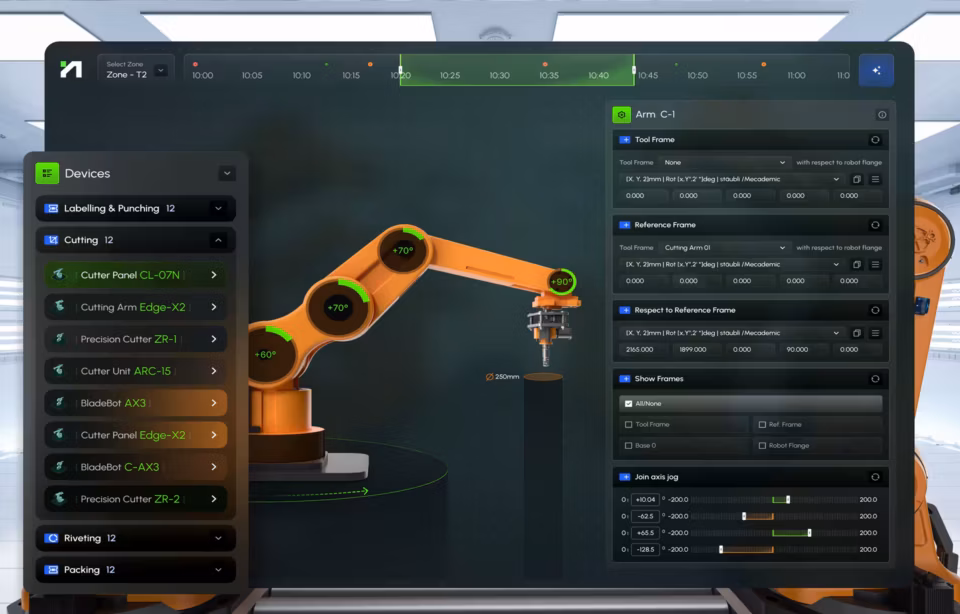
Fleet operations run on one or more of three platform types. Multi-vendor fleet managers, designed to coordinate heterogeneous fleets at the protocol layer, include KUKA.AMR Fleet, OMRON FLOW Core, and BlueBotics ANT server. Vendor-native consoles ship with specific robot product lines: Seegrid Supervisor, Rocla FleetController, Locus Robotics, Geek+, Symbotic, and the AGV and AMR lines now under Rockwell Automation and Zebra Technologies. The third type is the warehouse management system layer that increasingly absorbs dashboard responsibilities from both. Each ships with a dashboard. None of them was designed by a supervisor.
What separates a warehouse robotics fleet dashboard from a generic operations dashboard is the dynamic navigation problem. A fleet manager is not tracking a fixed asset that occasionally fails; it is coordinating mobile units that change position, task, and availability state several times per minute. The dashboard has to render meaningful summaries of that motion without overwhelming the supervisor, which is a constraint generic BI tools were not built for, and a constraint most agencies underestimate when they propose a dashboard scope.
The discipline is distinct from manufacturing dashboard design, which covers plant floor interfaces, fixed production equipment, and process automation. Warehouse robotics dashboards track dynamically navigating units across a building footprint and prioritize fleet coordination, exception handling, and recovery workflows for mobile robots rather than process state and equipment OEE. The interaction patterns and data architectures are different disciplines.
Supervisor decisions during a shift are what the dashboard exists to support, not the exhaustive display of all available data. Showing every robot’s coordinates in real time is the default vendor approach, and supervisors managing fleets of forty or more units stop reading those displays inside the first week. Effective dashboards surface the three or four robots that need attention right now.
A regulatory framework also shapes the discipline. ISO 3691-4 (safety requirements for driverless industrial trucks) and VDA 5050 (the AGV-to-master-control communication protocol) do not specify dashboard design, but they shape what the dashboard must reliably display: operating zone status, vehicle modes, emergency states, and the communication interface between the fleet management layer and individual robots.

Why most warehouse robotics dashboards get abandoned
Vendor-built robotics dashboards are optimized to display every robot’s current state. Warehouse supervisors need something different: which robots require intervention right now, what the recovery path is, and how the fleet is tracking against the shift’s volume targets. When the dashboard cannot answer those questions quickly, supervisors stop looking at it and run operations from radios while expensive robots sit waiting.
Status-display crowds out decision-support, and this is the most counterintuitive failure mode in the discipline. Most warehouse buyers assume real-time positioning is the dashboard’s most valuable feature, so vendors compete on map quality, animation fidelity, and the number of vehicles that can render on screen at once. None of that helps a supervisor running a peak hour of 30 robots. What the supervisor needs is a quick answer to a different question: which two robots are blocking the rest of the fleet, and what happens if those issues remain unresolved for 15 minutes.
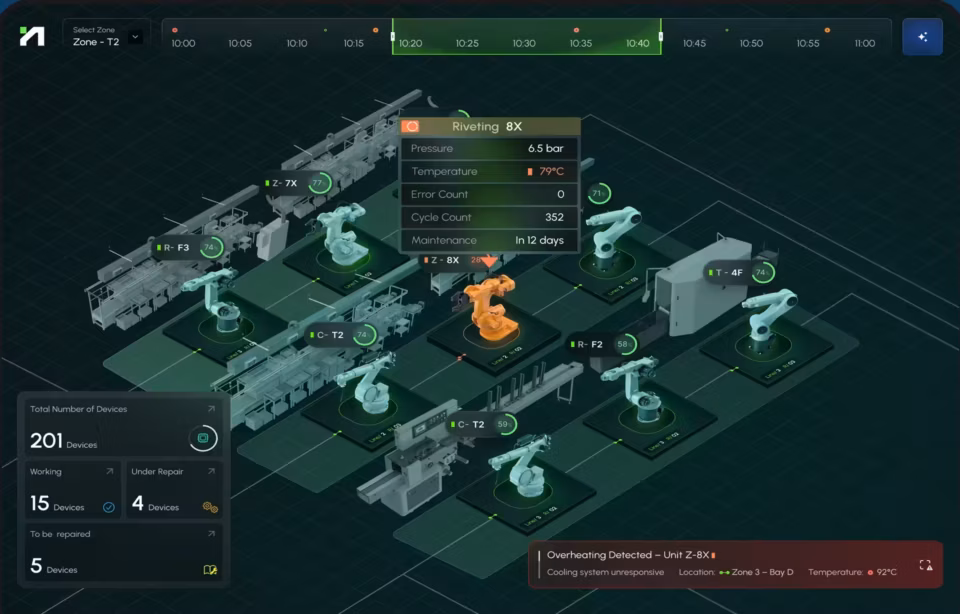
A real peak-hour exception storm makes the prioritization problem concrete. A supervisor on a Tuesday afternoon sees three faults land in the same minute: an AGV in the picking aisle reports a payload mismatch, an AMR in staging times out on a mission handshake, and a second AGV blocks a high-traffic intersection waiting for a recovery decision. None is the most critical individually. The supervisor’s choice is which to clear first to keep the wave moving, and a dashboard that lists them in arrival order or alphabetically forces a decision the supervisor cannot make from the data shown.
Recovery workflows often live outside the dashboard, and this is the most concrete version of the abandonment problem. When an AGV stalls in a charging dock, an AMR refuses a pickup because of a payload mismatch, or a unit faults in a mixed-fleet aisle, the supervisor leaves the dashboard, calls vendor support, and works the fix over the radio. The dashboard becomes a confirmation tool.
Mixed-fleet operations multiply the abandonment problem. Each vendor’s dashboard shows only that vendor’s fleet, and supervisors running two or more vendors in parallel stop trying to mentally consolidate the views. Manual coordination by radio becomes the workaround, and the formal dashboards on the screens behind the supervisor’s desk go untouched for entire shifts.
The mixed-fleet problem has a structural cause: vendor APIs were designed for single-vendor coordination, and the protocols that allow cross-vendor visibility are still maturing. Even where two vendors implement VDA 5050 compatibility at the protocol layer, their dashboards typically remain incompatible at the operational layer. A supervisor cannot see why Vendor A’s robots are waiting in the same aisle that Vendor B’s robots are blocking, because each dashboard renders only its own fleet’s view of the situation. The coordination layer ends up living in the supervisor’s mental model, which is not a layer the dashboard supports.
What replaces the abandoned dashboard is rarely formal. Supervisors fall back on radio communication, hand-written exception logs, and tribal knowledge of which units have been faulty that week. Operations continue, slowly, and the warehouse loses the data trail that the dashboard was supposed to capture. The next supervisor who walks into the shift inherits a system running below its automation potential.

Principles of operator-centric warehouse robotics dashboard design
Effective warehouse robotics dashboards rest most heavily on exception prioritization, which decides whether a supervisor uses the dashboard at all. Role-based views and integrated recovery workflows matter too, but they sit downstream of whether the dashboard surfaces the right alerts in the right order. A dashboard that shows everything to everyone has not yet solved the prioritization problem.
Exception prioritization is the discipline of deciding which alerts surface, in what order, and how aggressively. Vendor dashboards typically render every alarm with equal visual weight: low battery, blocked path, payload mismatch, communication timeout, manual stop, scheduled maintenance, all in the same scrolling list. The supervisor handling 40 robots cannot triage 30 alerts in 5 minutes, so they stop trying. Operator-centric design distinguishes between alarms that need intervention right now and those that can wait, and this distinction shows up in font weight, color, screen position, and audio; ultimately, it recognizes the human factor and reduces daily stress exponentially.
Recovery workflows integrated into the dashboard determine whether a supervisor stays in the interface or leaves it. When a robot faults, the dashboard either provides the next two or three actions inline (restart attempt, dispatch to maintenance, rerouting the queued mission) or sends the supervisor out to vendor-specific support channels. The VDA 5050 communication standard normalizes the protocol layer between fleet managers and vehicles, but protocol compatibility is not the same as integrated workflow design.
Role-based views are the least counterintuitive principle of the three and the easiest to get right. A shift supervisor opening the dashboard at 6 a.m. needs fleet readiness, while a warehouse manager opening the same dashboard needs throughput against weekly targets. Each role asks a different first question.
What these principles miss when taken as a static framework is that they describe design choices applied to a moving target. Warehouses change fleet composition, add a vendor, drop a vendor, shift from single-shift to three-shift operations, and double their throughput in a quarter. The dashboards that hold up across those changes are the ones designed to be reconfigured by operations teams, not only by engineering teams. The principle that quietly matters most is not on the list above: it is who owns the dashboard after launch.
The most counterintuitive design move in this category is reducing the amount of data shown on the primary dashboard. Vendor sales conversations almost always go the other direction: more data points, more visualization variety, more configurable widgets. In supervisor research, the dashboards that earn adoption are usually the ones that strip the primary screen back to four or five critical signals and route everything else to secondary views accessed on demand. Operations teams describe the simpler dashboard as the one they actually read.
Designing for mixed-fleet coordination
Mixed-fleet dashboard design is the discipline of building a single supervisor view across two or more robotics vendors operating in the same warehouse, where each vendor’s native dashboard shows only its own fleet. Effective mixed-fleet designs surface cross-vendor coordination conflicts, shared-aisle scheduling, and operational handoffs that single-vendor dashboards do not capture, allowing supervisors to manage the warehouse as a single system rather than as parallel vendor silos.
By 2026, mixed-fleet deployments will have become the dominant pattern in mid-size and large warehouses, driven by the limits of single-vendor scaling and the operational logic of matching robot type to task: AGVs for predictable long-haul routes, AMRs for dynamic pick zones, and sometimes a third vendor’s specialized arm or sorter in the mix. The buyer who sourced from one vendor in 2022 is rarely the buyer running operations in 2026.
In operational terms, the mixed-fleet coordination layer answers questions that the individual vendor dashboards cannot: which fleet should clear an aisle first when both have queued missions through it, how to schedule a charging window so two vendors’ robots do not compete for the same dock, and what the operator sees when a fault from Vendor A causes a downstream wait for Vendor B. The supervisor running operations across multiple dashboards is performing this coordination manually.
What distinguishes dashboards for mixed-fleet coordination from generic multi-tenant ones is where the unification happens. State representation has to be normalized so that every robot shows the same status flags regardless of the vendor API, allowing the supervisor to see one system rather than three. The shared resources that cause cross-vendor conflicts (aisles, docks, charging stations) need to appear as first-class dashboard objects rather than as background context. Exception handling remains fleet-agnostic, so a payload mismatch is detected the same way whether the data came from Vendor A or Vendor B.
The structural answer to the mixed-fleet problem may not come from the robotics vendors at all. Warehouse management systems (Manhattan Active Warehouse Management, Blue Yonder, SAP EWM, Körber One) have spent the last two years absorbing fleet visibility into the supervisor interface most warehouses already use, on the operational logic that extending the existing screen asks less of the supervisor than asking them to learn three more dashboards. Whether this becomes the dominant pattern in 2027 depends on whether WMS vendors can match the depth of fleet-management telemetry that robotics vendors have built into their own dashboards.
AI in warehouse robotics fleet dashboards
AI inside warehouse robotics fleet dashboards is machine learning deployed to anticipate exceptions, prioritize alerts, or surface anomalies that supervisors would otherwise discover only after operational delays occur. The valuable applications run upstream of the exception, not downstream: predicting which robot is likely to fault next based on battery state and error patterns, flagging an unusual route slowdown before it becomes a formal alarm, and suggesting which of three concurrent exceptions to clear first.
Predictive applications are where AI has the clearest return on warehouse robotics dashboards. Locus Robotics’ LocusINTELLIGENCE on the LocusONE platform uses machine learning on historical fleet data to flag robots likely to fail within the next 30 minutes based on battery state, error rates, and duty-cycle patterns. Ocado Intelligent Automation’s IQ platform does the same for Chuck and Porter AMRs (formerly 6 River Systems), surfacing predictions through the Bridge supervisor dashboard. Anomaly detection runs further upstream still, flagging a unit taking longer than usual on a known route or a battery degrading faster than the rest of the fleet.
These capabilities require a foundation that most warehouse deployments lack on day one. Predictive maintenance and anomaly detection models require 6 to 12 months of fleet operational data before their outputs are reliable, which is why the AI features promised in vendor demos rarely match what supervisors see in the first quarter of deployment. Fleet operators running multiple sites can shorten the cold-start window by transferring trained models between facilities, but the supervisor of a new warehouse should expect the AI layer to behave like a research project before it behaves like a tool.
AI-assisted triage handles the case where three exceptions land in the same minute, the peak-hour scenario described earlier. Early implementations are starting to recommend a clearance order based on downstream impact: which fault is blocking the most queued missions, which has the longest expected resolution time, which is in the highest-throughput aisle right now. The supervisor still owns the decision; the model does the arithmetic that the supervisor cannot do in five seconds. The category is real but emerging, and most fleet dashboards in 2026 still leave the triage burden entirely on the supervisor.
Where AI fails in warehouse robotics dashboards is when it gets piled onto a dashboard that the supervisor already finds unreadable. An exception list nobody triages in time does not become triagable when each item is now decorated with a probability score, and three suggested actions; the cognitive load increases, not decreases. In other words, sometimes less is more. Effective AI dashboard design starts with a layout that already works for the supervisor, then adds intelligence at the two or three decisions where prediction beats recollection or where calculation beats human estimation under time pressure.
Designing for warehouse supervisor workflows
Warehouse supervisors run distinct workflows during a shift: opening with a fleet readiness check, monitoring exception alerts during peak operations, resolving stalls without leaving the dashboard, and closing with a throughput review against targets. Effective designs are built around the decisions supervisors make at each moment, not around the data the robots happen to expose.
Shift opening is the first sixty seconds of the supervisor’s day, and the warehouse robotics fleet dashboard design that works at this moment answers the questions the supervisor will ask anyway: which robots came online overnight, what alarms accumulated, what was scheduled for maintenance, and what volume is on the inbound truck schedule. The alternative is for the supervisor to close the dashboard and walk to the floor.
Peak-volume exception handling is where operator-centric design either earns its place or loses it. During a wave or peak-pick hour, the supervisor is handling concurrent exceptions across the fleet while the wave continues to release. Designs that surface exceptions in priority order, group related faults from the same aisle, and offer one-tap recovery paths keep the wave moving, and the agencies that build them well usually do it inside a warehouse UI/UX practice with WMS integration experience and on-site operator-research depth.
Shift closeout produces the data the incoming supervisor needs and the data ownership needs for the weekly review. A dashboard that captures throughput against target, outstanding faults handed off to the next shift, and maintenance-window items scheduled for the gap between shifts provides the warehouse with a continuous record. A dashboard that resets at midnight loses the operational memory that prevents the same fault from appearing on three consecutive shifts.
Cross-shift continuity is the thread that ties the three workflows together. A dashboard that shows the supervisor’s exception log for today but omits last shift’s open faults forces every supervisor to rediscover the same problems. Designs that persist exception state across shifts, attach notes from prior supervisors, and clearly mark items waiting for a maintenance window solve a problem the warehouse runs into every morning.
Maintenance-window coordination is the workflow that gets the least dashboard support and produces the most operational friction. Robots need scheduled downtime for battery service, sensor calibration, or firmware updates, and supervisors handle this by tracking maintenance state in spreadsheets or vendor portals that are not connected to the operational dashboard. The result is robots that look available on the dashboard but are physically out of service, or robots scheduled for maintenance during peak hours because the schedule was never visible to the supervisor managing the wave.
Case study: Robodog warehouse robotics fleet dashboard
The Robodog warehouse robotics fleet dashboard is a Fuselab Creative project that gave warehouse supervisors a single supervisor-facing view across AGV operations. The scope covered mission control, fleet position, alerts and proactive monitoring, load distribution analysis, and mission configuration, all consolidated into an interface designed for supervisors managing AGV fleets on the warehouse floor rather than for vendor support engineers configuring routes from a back office. The Robodog project page has the visual reference.
Design work on the project centered on what supervisors actually do when an exception lands. Mission queue, proactive alerts, and load distribution all sit on the primary view so a supervisor can rebalance before a unit overloads or starves, clear blocking alerts before they propagate, and rerun mission configuration as an inline flow rather than a vendor-tool handoff. The principle is that everything a supervisor reaches for during a peak hour should be one click away, not three.
What separates a dashboard that gets used from one that gets abandoned is whether it earns the supervisor’s attention during a peak-hour exception storm or loses it inside the first month. The interfaces that earn attention surface the right information at the right moment, and the ones that lose it ask the supervisor to translate raw fleet state into a decision the dashboard could have made visible. On Robodog, the priority ordering, the placement of recovery actions, and the inline mission configuration were all design moves toward the first outcome.
Across warehouse robotics engagements, the same pattern shows up. The operations teams that check the dashboard between calls have made it part of their workflow; the ones that only open it after an incident never developed that habit, and they abandon it first when volume picks up. The work of distinguishing the two outcomes is what warehouse robotics dashboard design as a discipline now consists of.
How to choose an agency for warehouse robotics fleet dashboard work
Agencies worth shortlisting for warehouse robotics fleet dashboard work have shipped at least one interface running in a live commercial deployment. Without that, every other criterion is a proxy. Research methodology, portfolio depth, and stated capability in warehouse environments all matter, but they sit downstream of whether anyone has watched a real supervisor handle a peak-hour exception storm with a real fleet.
Portfolio evidence is the first filter. A genuine warehouse robotics dashboard credential is a named interface running in commercial deployment with a stated client, not a concept design or a personal project. Manufacturing dashboard work or generic SaaS interfaces do not transfer cleanly. The data architecture of a fixed-position production line and that of a forty-unit AGV fleet are distinct problems with different supervisor decision contexts.
Research methodology matters next. Designs that work in active warehouse conditions come from on-site UX research with supervisors during shift transitions and peak operations, not from remote video interviews. The agency should know which safety standards govern the deployment, including ISO 3691-4 for driverless industrial trucks, and should understand that operator-zone preparation and supervisor-zone monitoring are intertwined design constraints.
On-site observation produces specific deliverables that desk research cannot replicate: a behavioral map of which dashboard regions the supervisor’s eyes return to most often during a peak hour, an exception inventory categorizing the alerts the supervisor handled by hand because the dashboard could not, and a workflow trace of when the supervisor left the screen and what they did off-screen. Without these artifacts, the design choices that follow are grounded in agency assumptions rather than in observed supervisor behavior.
Design decisions tied to operator workflows are the third filter and the most visible in the portfolio. Ask the agency how they decide which alarms surface and which suppress, how they handle a vendor-specific fault within a multi-vendor fleet view, and what they did when research showed a supervisor doing something the dashboard was not designed to support. The answers reveal whether the design centers on the supervisor.
The disqualifying signals are easy to spot. A portfolio dominated by conceptual mockups and Dribbble shots, regardless of polish, suggests an agency that has done a lot of branding and not much shipping. An AGV or AMR credential that cannot be attached to a specific warehouse, a named client, and the supervisor team using the dashboard is a credential that the agency has been encouraged to claim, not earned. Generic SaaS dashboard work cited as comparable evidence is the most common substitution, and an agency that confused the two during the sales conversation will confuse them during the project.
Ship-in-deployment is the criterion that filters most generalist agencies out of warehouse robotics work. Concept designs and Behance portfolios do not test against 40 units under active commercial conditions; only a live deployment surfaces the interaction problems the design must solve. The agencies worth shortlisting can name at least one warehouse operating their dashboard right now, with the supervisor still using it.
Conclusion
Warehouse robotics fleet dashboards earn their place when supervisors actually use them, and most do not. The ones that get used were designed around the questions supervisors ask during the shift, not around the data each vendor’s API exposes. The discipline is young, the standards still maturing, and the work of distinguishing dashboards that supervisors trust from the ones quietly abandoned behind their desks is being done right now.
Frequently asked questions
What is warehouse robotics fleet dashboard design?
Warehouse robotics fleet dashboard design is the practice of building supervisor interfaces that consolidate operational data from automated guided vehicles, autonomous mobile robots, or mixed fleets into a single view of warehouse operations. The discipline differs from generic dashboard design because it has to render meaningful summaries of mobile units that change position, change task, and change availability state several times per minute, a constraint that generic BI tools were not built for.
What is fleet exception management in warehouse robotics?
Fleet exception management is the discipline of detecting, prioritizing, and resolving fleet exceptions before they cascade across warehouse operations. Common exceptions include blocked aisles, payload mismatches, communication timeouts, low-battery faults, and stalled units in charging docks. Effective dashboards surface high-priority exceptions ahead of routine status updates so supervisors can intervene in order rather than scan the full alert list.
What is the difference between AGV and AMR?
AGVs (Automated Guided Vehicles) follow predefined navigation paths set by physical infrastructure such as magnetic strips, wires, or QR codes embedded in the warehouse floor. AMRs (Autonomous Mobile Robots) navigate dynamically using sensors and on-board software, allowing them to reroute around obstacles without infrastructure changes. Many modern warehouses run mixed fleets combining both types under a single fleet management layer.
How does warehouse robotics fleet dashboard design differ from manufacturing dashboard design?
Warehouse robotics fleet dashboards track dynamically navigating units across a building footprint and prioritize fleet coordination, exception handling, and recovery workflows for mobile robots. The manufacturing dashboard design covers plant-floor interfaces, fixed production equipment, real-time sensor streams, and process automation. The interaction patterns, data architectures, and operator decision contexts are different disciplines.
How much does a warehouse robotics fleet dashboard design project cost?
Warehouse robotics fleet dashboard projects typically cost between $25,000 and $250,000 with a US-based specialist agency, depending on scope. Smaller engagements covering a single supervisor view start around $25,000, while mid-size projects integrating multiple vendor APIs or building full recovery workflow design run $75,000 to $150,000. Hourly rates for specialist agencies generally range from $100 to $250.
How long does a warehouse robotics fleet dashboard design project take?
Warehouse robotics fleet dashboard projects typically take 4 to 8 months from research to engineering handoff, depending on the depth of on-site research, the number of vendor APIs integrated, and whether the scope includes role-based views and full recovery workflow design. On-site research alone often takes 4 to 6 weeks because it requires observation across shift transitions and peak-volume operations.
What should I look for in an agency for warehouse robotics fleet dashboard work?
Qualified warehouse robotics fleet dashboard agencies have shipped at least one named warehouse robotics interface in live commercial deployment, demonstrated on-site research in active warehouse operations, and produced case studies that tie design decisions to supervisor workflows. An agency that has shipped only manufacturing dashboards or generic SaaS interfaces is unlikely to handle the dynamic navigation complexity warehouse robotics dashboards require.