12
min read
12
min read
 Oct 7, 2026
What is digital twin design? A 2026 guide for product teams
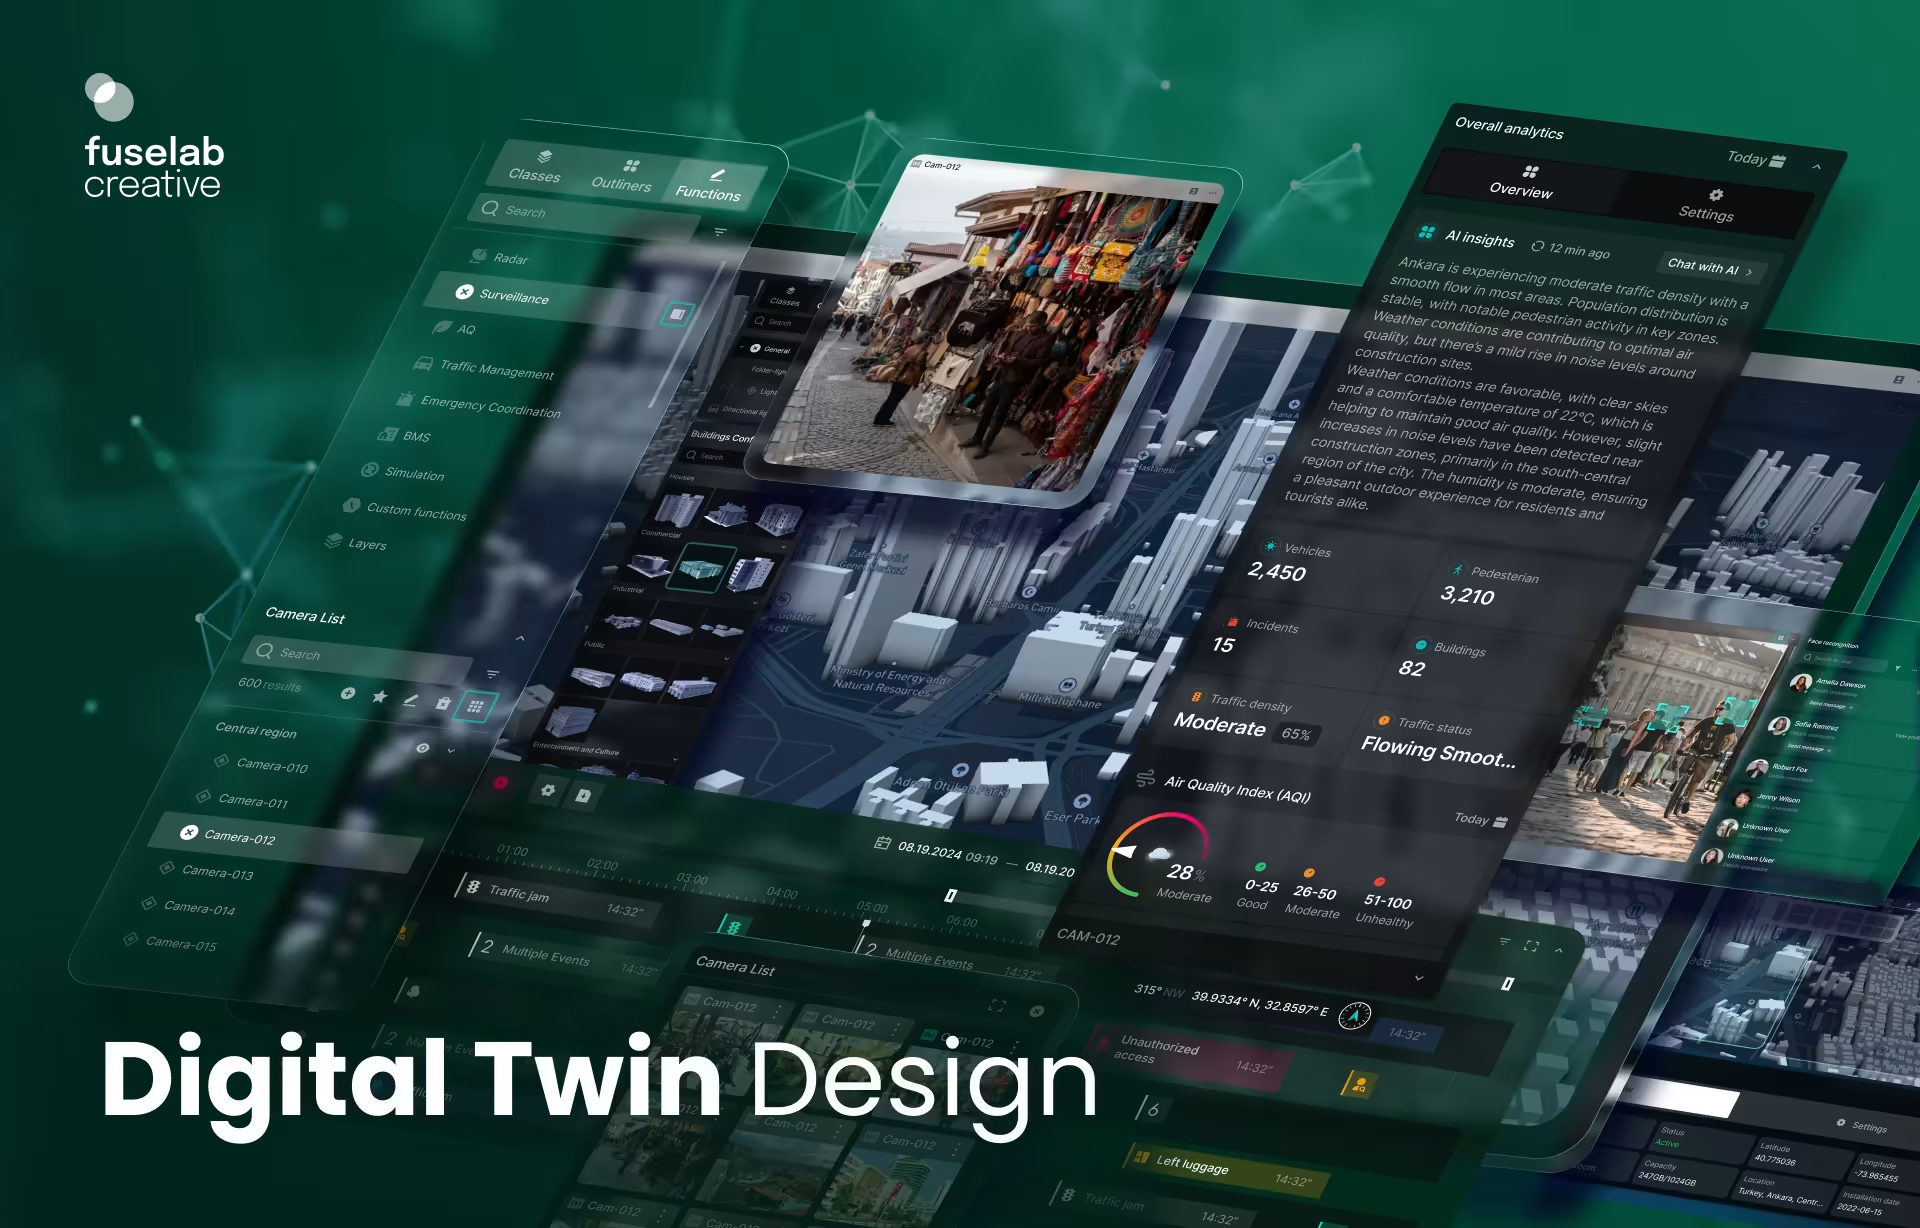









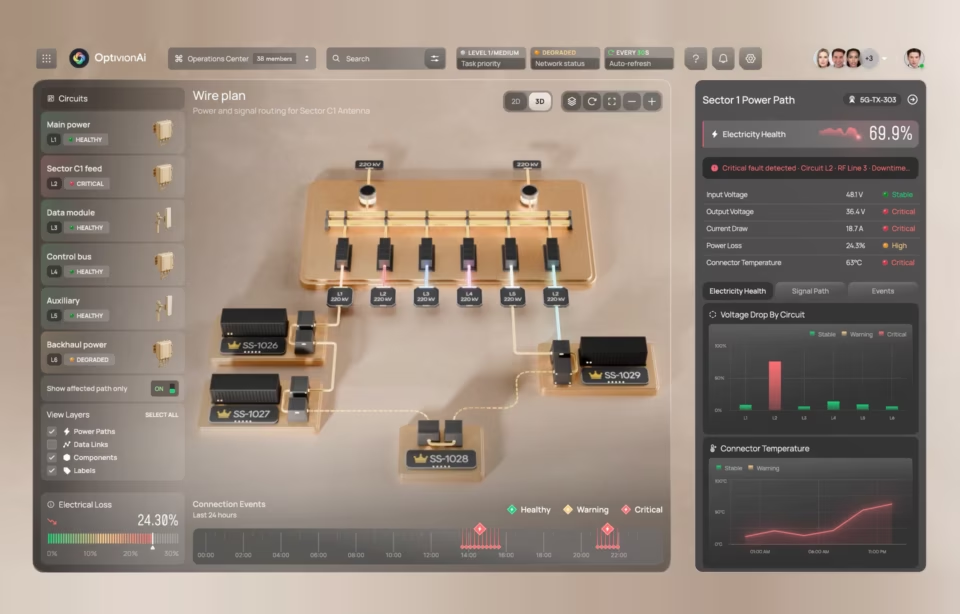
A digital twin is a virtual replica of a physical object, system, or process that stays synchronized with its real-world counterpart through live sensor data, and digital twin design is the work of building that twin across its full stack: the asset model, the data and IoT connections, the simulation logic, and the visualization layer people use to act on it. Those first layers absorb most of the engineering investment, yet the part that decides whether the twin gets used is the interface an operator reads under pressure, and it is usually built last.
What is a digital twin?
A digital twin is a virtual replica of a physical object, system, or process that mirrors its real-world counterpart in real-time, drawing live data from sensors, operational systems, and environmental inputs to remain continuously in sync. Unlike a 3D model or a one-off simulation, it updates as the physical environment or structure changes, allowing teams to monitor performance, test scenarios, and predict failures against the current state rather than a static snapshot.
The concept traces back to Michael Grieves, who introduced it at the University of Michigan in the early 2000s, and it has since moved from aerospace research into mainstream industry. NIST, the US standards agency, estimates that digital twins could be worth $37.9 billion a year to US manufacturing alone if adopted across the sector. That scale is why every major industrial vendor now sells some version of the technology.
The distinction that matters for designers is the live connection. A blueprint or a CAD file represents intent. A digital twin represents the current reality of one specific physical asset, fed by data that changes minute to minute. That difference is what turns a visual model into an operational instrument, and it is also what makes the interface harder to design, because the screen has to stay readable while the numbers underneath it never stop moving.
Digital twin vs simulation: the difference that decides everything
A simulation is a self-contained model that runs predefined scenarios on static or historical data to answer “what if” questions, while a digital twin is permanently connected to a specific physical asset and updates itself with that asset’s live data. A simulation tells you how something should behave in theory. A digital twin tells you how one particular machine, building, or system is behaving right now, which is why the two are built, used, and designed differently.
Most simulations are run once, reviewed, and set aside. A digital twin is never finished, because the physical asset it tracks keeps operating, so the twin keeps ingesting data and the people watching it keep needing answers from it. That permanence changes the design problem entirely. A simulation interface can be a report. A digital twin interface has to be a live workspace that someone returns to every day and trusts under operational pressure, and it is closer to simulation interface design than to static reporting.
A digital twin usually contains simulations that it uses to forecast what happens next based on the live data it receives. The simulation is a component. The twin is the connected, continuously running system that wraps around it. Confusing the two is a common reason a project scoped as a digital twin ends up delivering a simulation no one can operate. And, honestly, it’s a sign you’ve contracted an inferior agency.
The differences line up cleanly across a few attributes:
The architecture of a digital twin: the five layers
A digital twin architecture is the stack of layers that keeps a virtual model synchronized with its physical counterpart. It almost always has five:
- Sensing layer: captures live data from the physical asset through sensors and IoT devices.
- Data layer: cleans, structures, and stores that data so it can be trusted.
- Analytics or simulation layer: interprets the data and forecasts what happens next.
- Integration layer: keeps the model and the physical asset continuously in sync.
- Visualization or application layer: where people see and act on what the twin knows.
Almost every published account of digital twin architecture names that last layer and then moves on. The sensing, data, and analytics layers get the engineering attention because that is where the hard computation lives. The visualization layer usually gets a single sentence about dashboards.
That imbalance is backward from the user’s point of view. The operator never touches the sensing layer. They live entirely inside the visualization layer, and if it is confusing, the accuracy underneath it never reaches the person who needs it. In other words, you just wasted a ton of money.
This is the layer where the interface design happens, and the decisions that shape it are interface decisions, not engineering ones. They determine whether the twin still gets used six months after launch, long after the model has been validated and the sensors are streaming clean data. Designing them well is a discipline in itself, with a handful of questions that separate an interface people trust from one they abandon.
How a digital twin is created
Creating a digital twin involves four stages:
- Model: build a digital representation of the physical asset.
- Connect: link it to live data through sensors and IoT systems.
- Synchronize: keep the model updating as the asset changes.
- Validate: confirm the twin’s behavior matches the real asset closely enough to trust.
Building the model can be demanding on its own, especially where the physics, simulation, or calibration is complex. Even so, the connection, synchronization, and validation are usually where the largest operational risks emerge.
The order matters more than teams expect. A common failure is to build a detailed model and a polished interface first, then discover the live data feeding it is incomplete, delayed, or structured in a way the design never anticipated. By then the interface has to be rebuilt around what the data actually delivers. The data architecture should be mapped before the visual design is committed, not after.
Validation is the stage that separates a real digital twin from a convincing demo. A model that looks right but quietly drifts from the physical asset can be more dangerous than no twin at all, because people trust it and make decisions on it. Continuous validation against live performance is what earns the operator’s trust, and without that trust the rest of the system goes unused.
Where digital twin design pays off
Digital twins earn their keep in industries where physical assets are expensive, distributed, or dangerous to test directly: manufacturing, construction, energy, transportation, and healthcare. In each, the twin lets teams monitor live performance, simulate changes before committing and predict failures before they occur, replacing costly physical prototyping and reactive maintenance with continuous, data-led decisions.
McKinsey reports that in advanced industries, almost 75% of companies have already adopted digital twins at medium or higher complexity, that some teams using them have cut development time by 20 to 50%, and that senior R&D leaders have reduced the number of expensive preproduction prototypes from two or three to one. The pattern is not a joke; it is completely consistent across industries. The twin pays for itself by moving testing out of the physical world and into a cheap-to-iterate model.
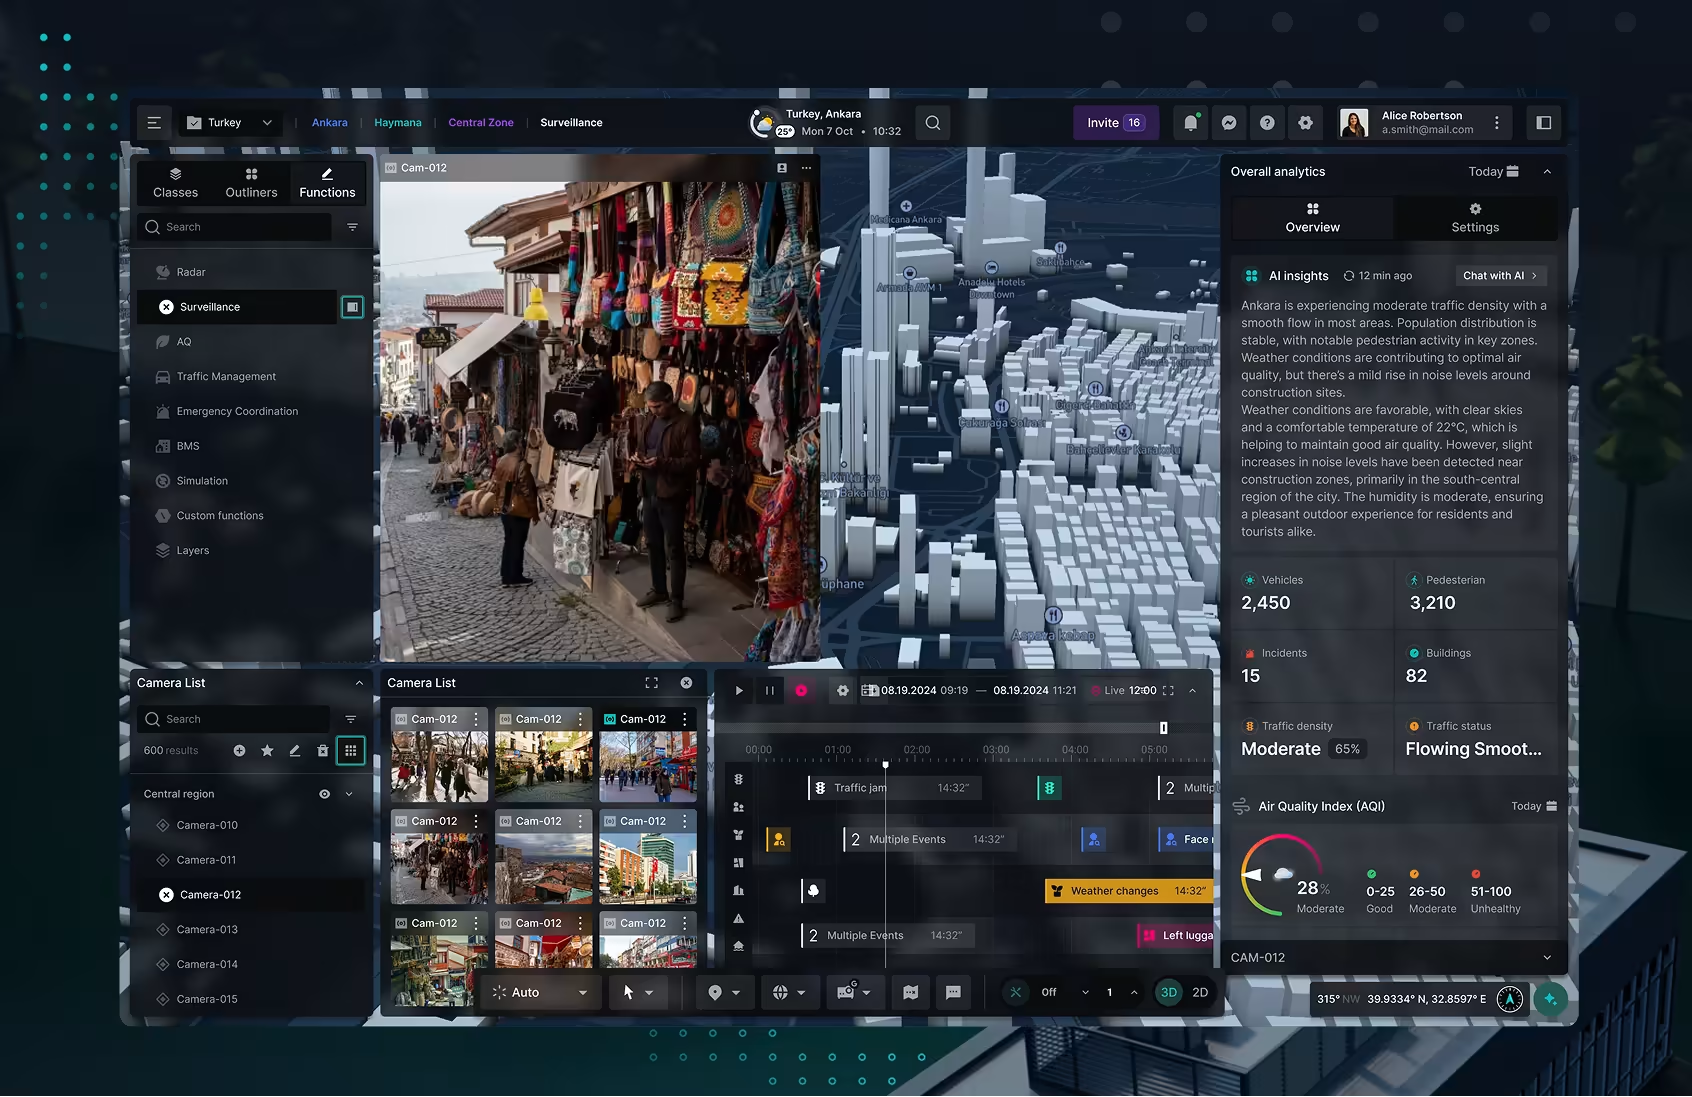
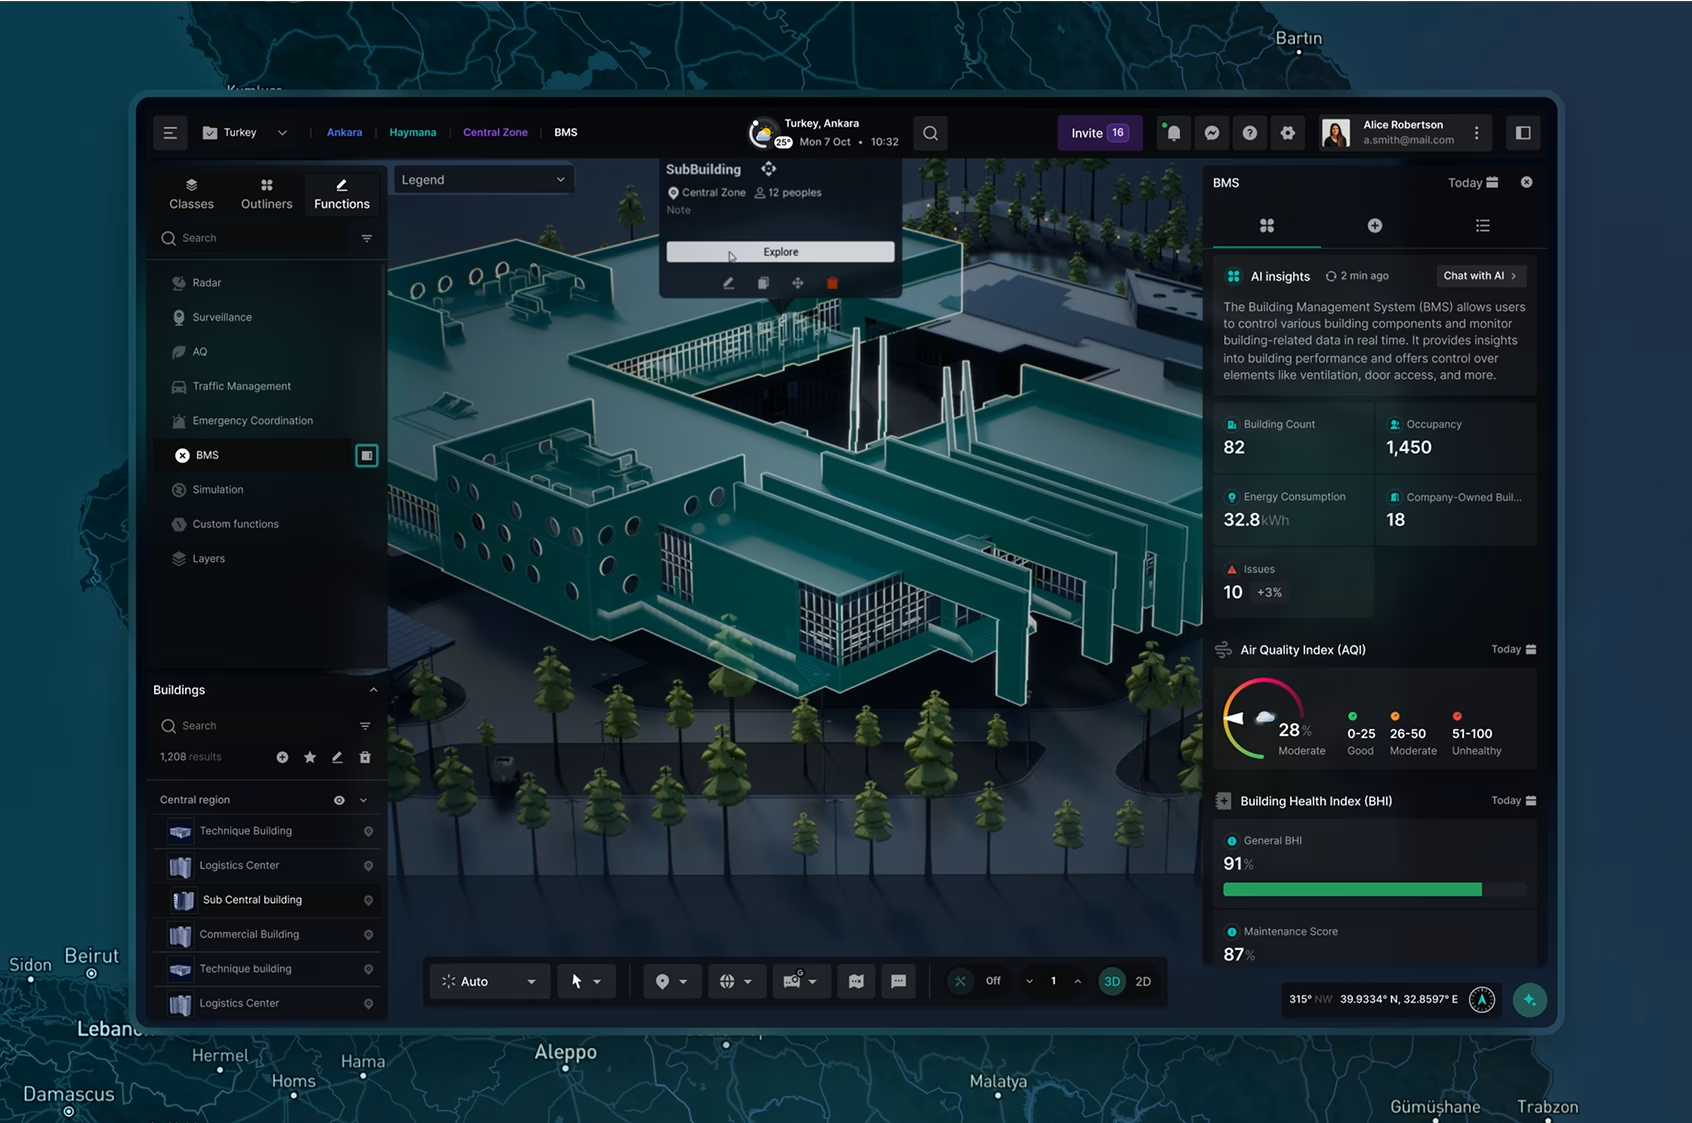
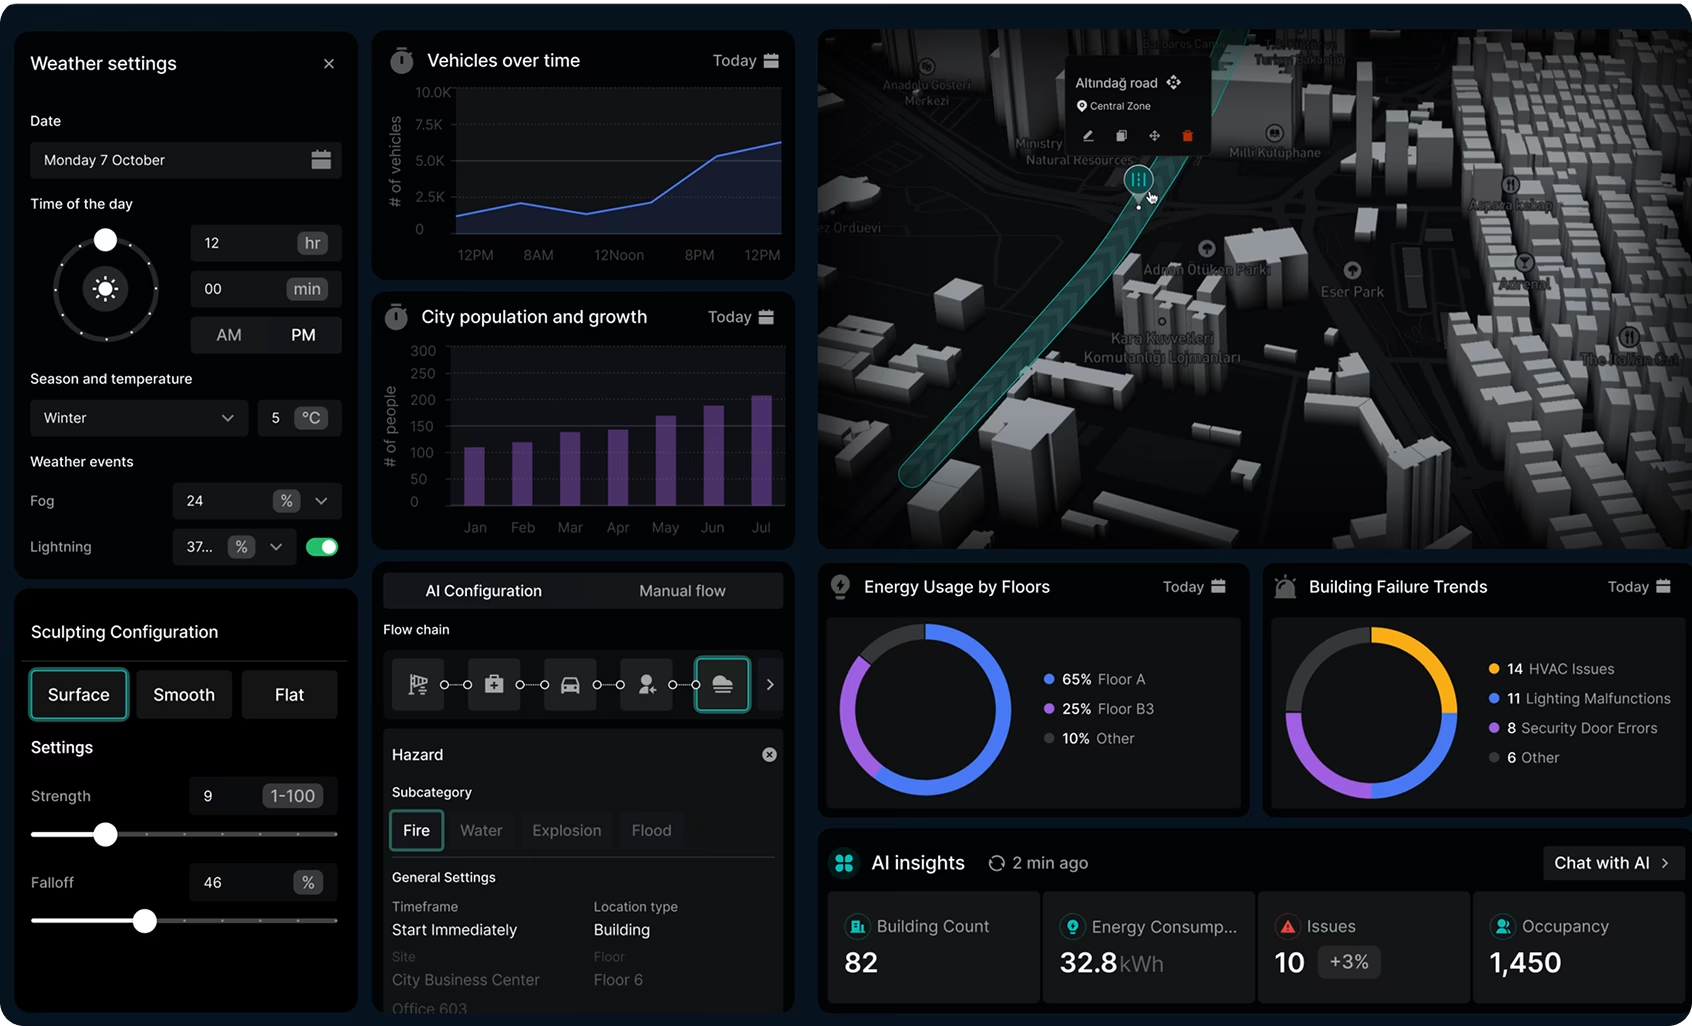
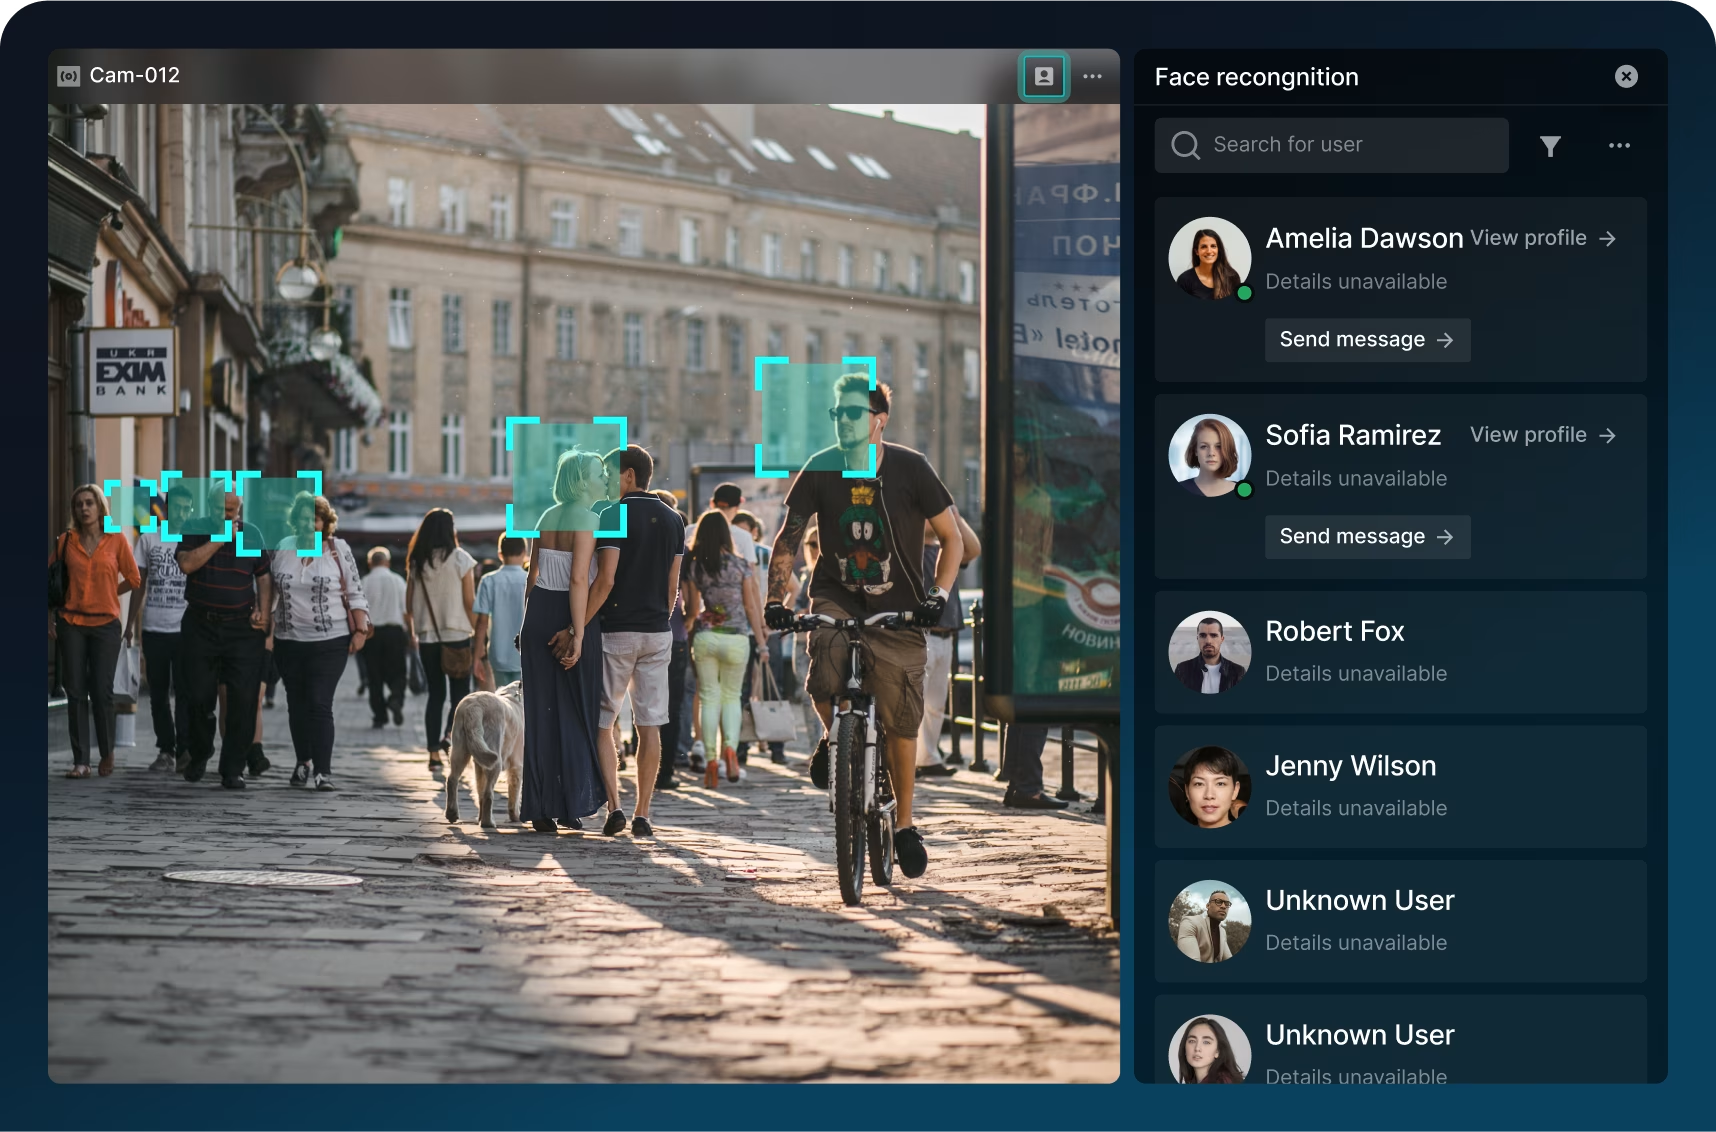
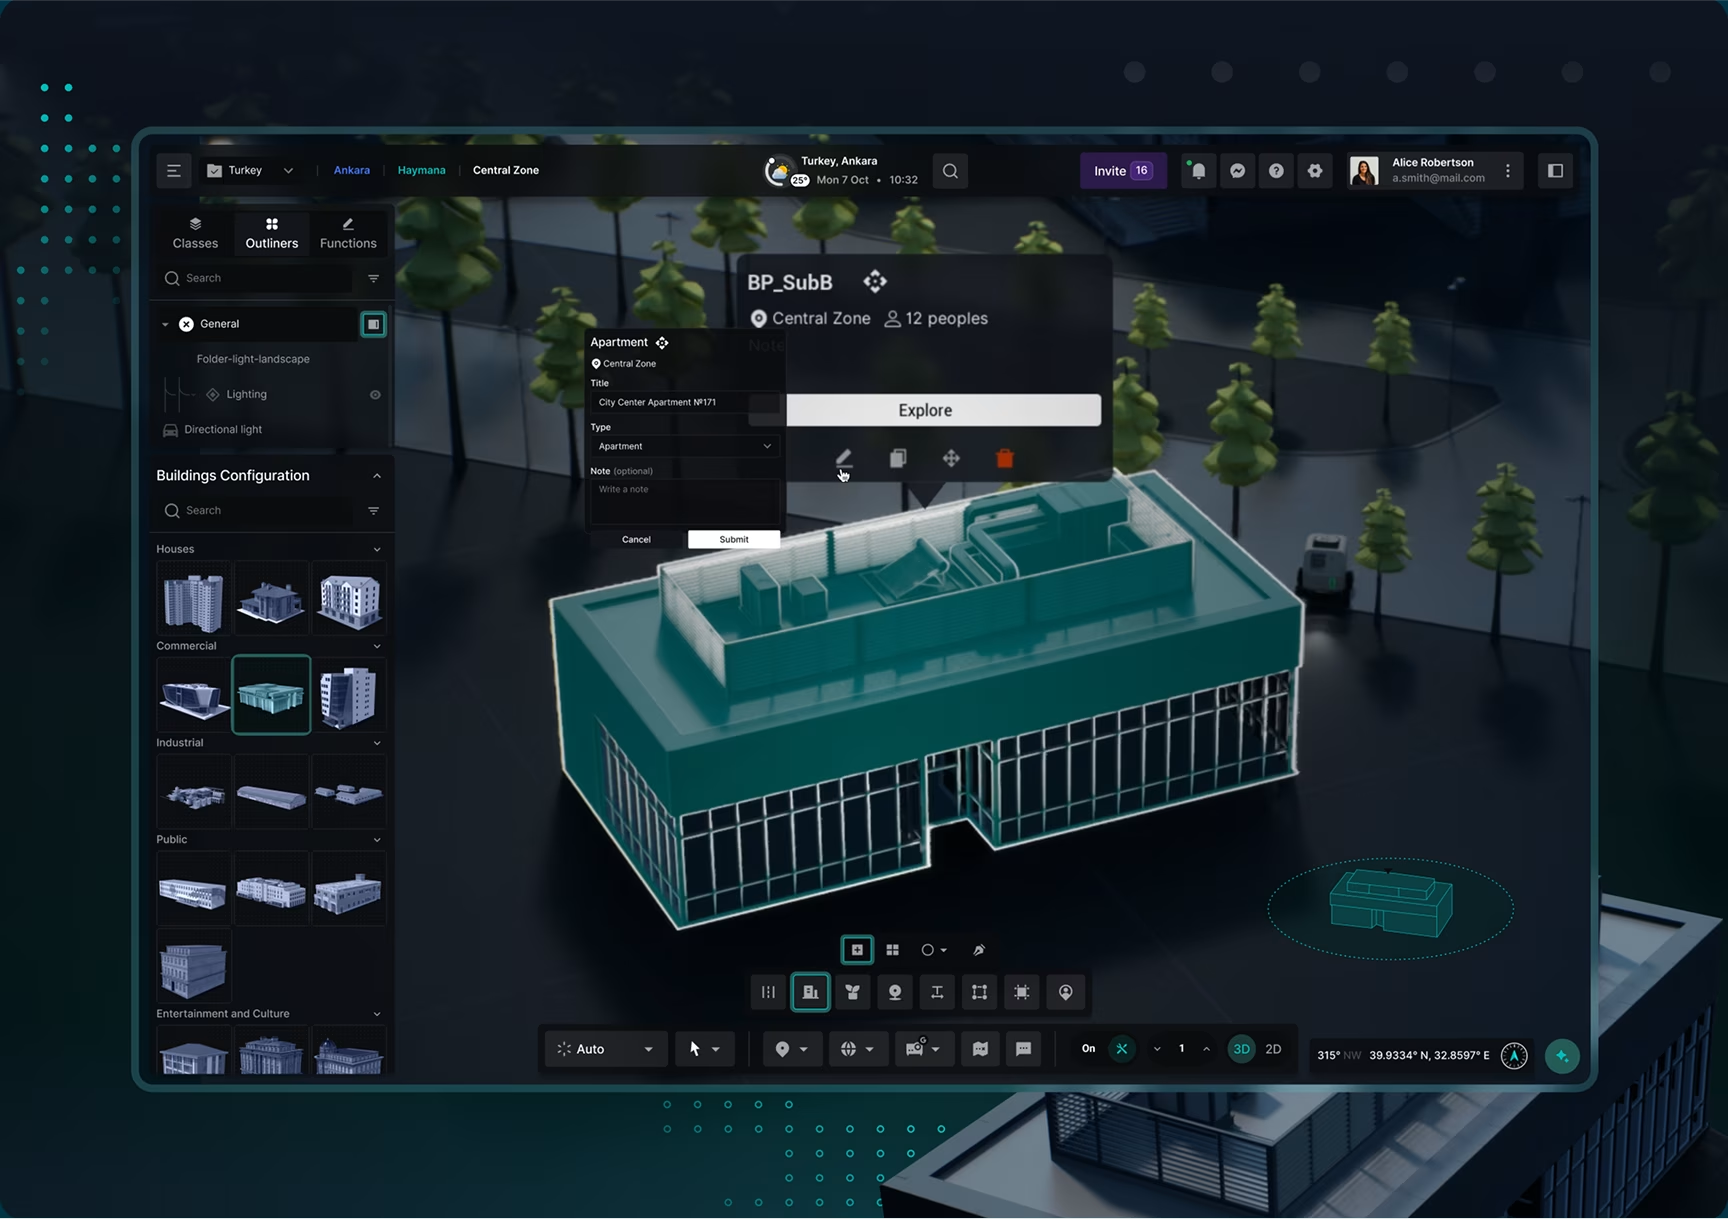
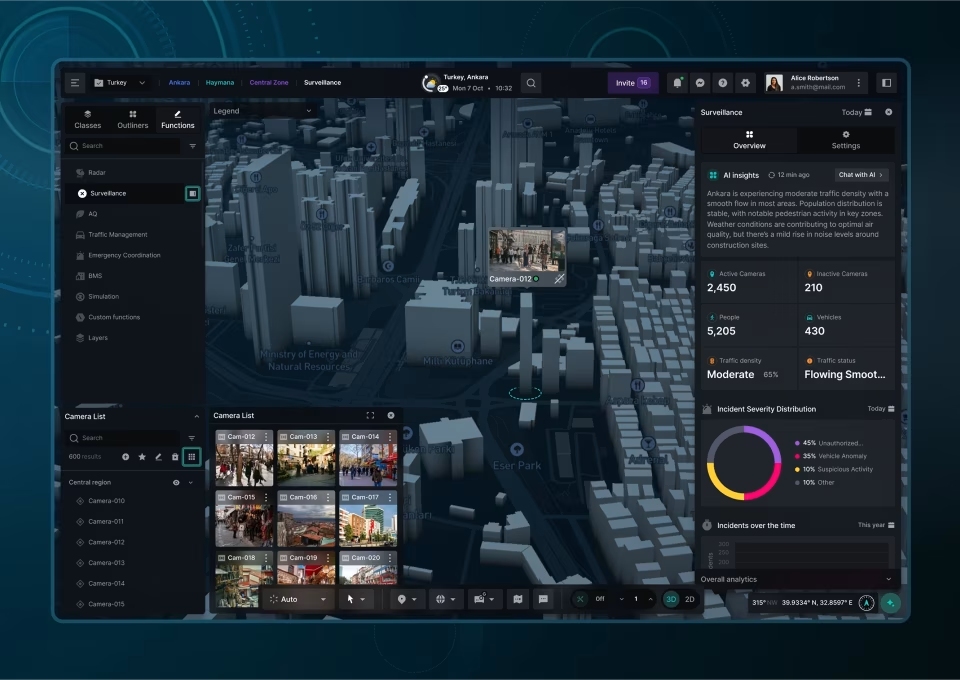
The work compounds when one twin serves several operators at once. DMF, the smart-city platform we designed, runs one live model of a city that very different people depend on at the same time: a security team watching camera feeds and AI face-recognition alerts, an analyst reading air-quality data against the weather forecast, a facility manager controlling a building’s ventilation and power, and a controller tracking aircraft and ships on the same map. Each one needs a different view of the same model, and the hard part is typically the user’s ability to trust, not the design polish. No operator could be buried in another’s data, and every reading had to be legible the moment it mattered.
Logistics shows the same shape. Automatize, a fleet platform we redesigned, had grown into ten separate systems that barely spoke to each other, so no manager could see the whole operation in one place. We consolidated them into a single live map backed by more than a hundred data points per truck: location, speed, fuel, trip stage, even tire pressure and cab temperature. It is a telematics system rather than a full digital twin, but the design test is the same, which lets a manager read the entire fleet at a glance and then drill into one vehicle without losing the picture.
Common mistakes in digital twin design
The most common digital twin mistakes are not coding errors. They are judgment errors:
- Over-modeling: building more fidelity than the decision actually needs. Often found in novice design shops, trying to show off.
- Platform-led workflow: letting a software platform’s default dashboard dictate how the operator works.
- Data after interface: mapping the live data feed only after the interface is designed.
- One view for everyone: designing a single screen for users with completely different jobs.
Each one tends to produce a twin that impresses in a demo and gets quietly abandoned in daily use.
Over-fidelity is the most expensive of them. Teams chase photorealistic 3D and deep physics, even though the use case never requires them. Then they end up spending the bulk of the budget on a model no operator needs at that resolution, while the interface that decides daily usefulness gets whatever time is left. Fidelity should be set by the decision the twin supports, not by how impressive the model looks in a pitch.
A close second is letting the platform choose the workflow. Most digital twin software ships with a default dashboard, and accepting it is the path of least resistance. That dashboard was built for a generic buyer, not for the specific operator who has to act on an alert at 3 am. The workflow that the operator needs should be designed first, then the platform configured to serve it.
The rest share a root. The model gets treated as the product, and the people using it as an afterthought. A twin earns its place only when the person watching it can act faster because of it. Everything else is a very expensive 3D model.
How to evaluate a digital twin interface
A digital twin interface earns its place when an operator can act faster because of it, not when the model looks impressive in a demo. Before we sign off on one, we put it through five questions, and in our experience most interfaces, even from strong engineering teams, miss more than one:
- What does the operator see first when something is wrong? The most decision-relevant state has to win the screen, not the prettiest visualization.
- Does the interface show when the model is confident and when it is guessing? A forecast shown as a clean number with no signal of how far to trust it is a trap.
- Can each role see the same model without drowning in the others’ data? A plant manager and a maintenance engineer need different cuts of one model.
- How does the 3D view connect to the live numbers? If the geometry and the data are not bound together, the 3D is decoration.
- How does an alert read at 3am with no context? The interface has to carry the meaning, because the person reading it will not have the backstory.
The second question is the one almost everyone gets wrong. A digital twin is a prediction engine, and predictions carry confidence levels, but most interfaces render a forecast as a single confident number. An operator who cannot tell a strong reading from a guess will over-trust the system until it burns them once, then stop trusting it for good. Designing that uncertainty in is actually harder than hiding it, and it is the clearest line between an interface people rely on and one they quietly abandon.
The other four are skipped for the same reason: the interface is treated as the final step rather than the layer that the whole system exists to serve. Teams spend months on data fidelity and days on the screen, then wonder why operators fall back to spreadsheets. Getting this layer right is a specific discipline, closer to dashboard and control-room design than to 3D modeling, and it is what our digital twin design services cover. The model can come from anywhere. The layer people work in every day is what they remember.
Conclusion
Digital twins are moving from aerospace research into everyday industry, and the teams that get value from them are the ones that treat the interface layer as seriously as the data underneath it. The model proves a concept. The layer people work in decides whether it lasts. For a closer look at that layer, explore our data visualization work.
Frequently asked questions
What is a digital twin design?
Digital twin design is the work of building a digital twin across its full stack: the asset model, the live data and IoT connections, the simulation logic, and the visualization layer people use to act on it. The interface and visualization layer is the part that decides whether operators trust and rely on the twin, and it is the part most teams underbuild.
What is a digital twin used for?
Digital twins are used to monitor a physical asset’s live performance, test changes in a virtual environment before applying them, and predict failures before they happen. Common uses span manufacturing, construction, energy, transportation, and healthcare, anywhere physical testing is expensive, slow, or risky.
What is the difference between a digital twin and a simulation?
A simulation runs predefined scenarios on static or historical data to answer “what if” questions, then is set aside. A digital twin is permanently connected to a specific physical asset and updates with that asset’s live data, so it reflects how the asset is behaving right now rather than how a model behaves in theory.
Is a digital twin the same as a 3D model?
A digital twin is not the same as a 3D model. A 3D model is a static visual representation, while a digital twin is continuously fed live data from its physical counterpart and changes as that asset changes. A 3D view is often part of a twin’s interface, but the live data connection is what makes it a twin.
How is a digital twin created?
Creating a digital twin involves building a model of the physical asset, connecting it to live data through sensors and IoT systems, synchronizing the two, and validating that the twin matches the real asset. Building the model can be complex on its own, but the data connection, synchronization, and ongoing validation usually carry the most operational risk.
What industries use digital twins the most?
Manufacturing, construction, energy, transportation, and healthcare use digital twins most heavily, because each manages physical assets that are costly or dangerous to test directly. Smart cities and supply-chain operations are fast-growing areas, where a single twin often serves several operational teams at once.
What should you look for in a digital twin design partner?
Look for a partner with direct experience designing live data interfaces, dashboards, or control-room systems, not only 3D modeling. The hardest part of the work is keeping a constantly updating system legible and trustworthy for the people who operate it, so ask to see how their work handles real-time data, alerts, and multiple user roles.