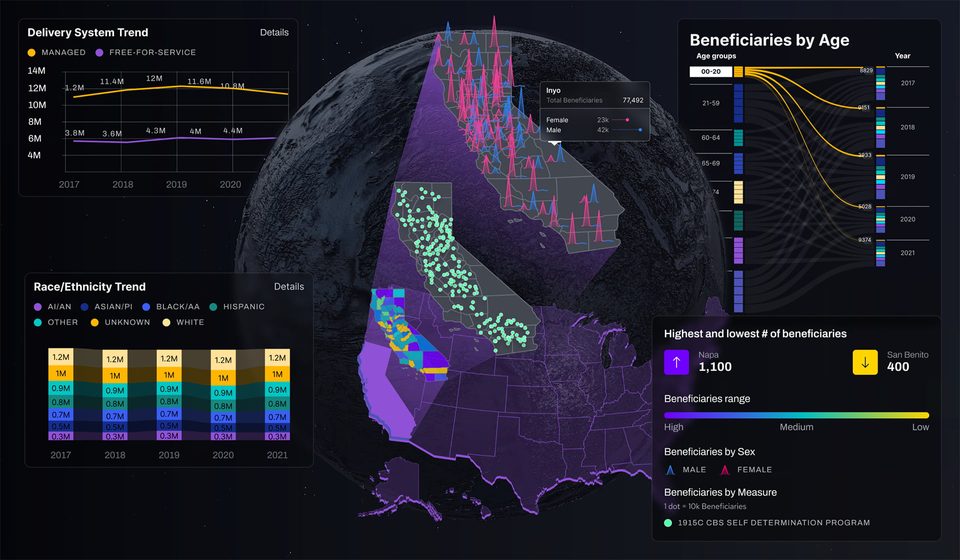
Business dashboards: the types and how each changes the design

Business dashboards present business data in a structured way to support monitoring, analysis, or decision-making. Because dashboards serve different purposes, their design should reflect who is using them, how quickly they need to act, and what they need to do after seeing a change.
A warehouse supervisor monitoring live operations needs different refresh behavior, information density, alerts, and permissions from an executive reviewing quarterly performance.
What Are Business Dashboards?
Business dashboards are interfaces that bring data from one or more organizational systems into a focused view, allowing users to monitor important information without opening each source system separately. Nielsen Norman Group describes dashboards as collections of data visualizations designed for at-a-glance understanding, with visual form helping users interpret quantitative information quickly.
A dashboard is not simply a collection of charts. It is an interface organized around a specific monitoring or decision-making task. A factory supervisor may need to identify which assembly line has stopped and decide where to intervene. A finance leader may need to determine whether revenue, margins, or other business measures are moving in the expected direction.
Both users may rely on business data, but they need different information architectures. A dashboard should therefore be classified by the job it supports rather than by the visual components it contains. The same line chart may appear in an operational, analytical, or strategic dashboard; what changes is the context, level of detail, and expected user action.
The Three Types of Business Dashboards: Operational, Analytical, and Strategic
A practical three-part framework groups business dashboards into operational, analytical, and strategic types. The distinction is based on the decision the dashboard supports:
- Operational dashboards help users respond to current conditions.
- Analytical dashboards help users investigate patterns and causes.
- Strategic dashboards help users evaluate progress over a longer period.
These categories are broad rather than mutually exclusive. A single product may contain separate operational, analytical, and strategic views.
Operational dashboards support people who monitor an active process, such as warehouse supervisors, support queue managers, or production teams. They prioritize current status, exceptions, and immediate priorities. Robodog AGV’s warehouse automation dashboard is an example of an operational interface. It provides real-time monitoring, mission control, fleet information, and controls for managing automated guided vehicles.
Analytical dashboards support users who are trying to explain a pattern or investigate a change. They provide more opportunities for comparison, filtering, segmentation, and drill-down than a purely operational view.
Aircraft Bluebook illustrates this model through an aviation valuation and aircraft research platform. Its features include aircraft comparisons, market assessment views, sales reporting, saved valuations, and advanced search. Users can move from a broad market view to specific records behind a valuation, making the interface suitable for exploration and investigation.
Strategic dashboards support users who track targets, performance, or market movement over months or years. They usually emphasize aggregated metrics, trends, benchmarks, and progress against goals.
The Fiserv Small Business Index is an example of a strategic dashboard. It combines business data visualizations, geographic maps, sector and regional search, and periodic updates to help policymakers, economists, investors, and small-business owners understand spending trends across the United States.
The three categories connect the dashboard’s purpose with its interface behavior. The relevant question is not which dashboard type looks best, but which type supports the user’s decision most effectively.
How the Business Dashboard’s Type Changes the Design
A dashboard’s category affects more than the labels attached to its charts. Operational, analytical, and strategic dashboards require different decisions about data freshness, information density, alerting, user permissions, and interaction because each supports a different kind of decision.
Refresh cadence
Refresh cadence should follow decision latency rather than dashboard category alone. Operational users may need frequent updates when a process changes quickly, while analysts may place greater value on a consistent historical dataset for comparison.
If an operations team is monitoring equipment or production activity, stale information can direct attention toward the wrong problem. The interface should show when data was last updated and provide visual cues when a source has not refreshed as expected.
For an analyst investigating sales performance, frequent updates may be less important than reliable historical data. Filters, date comparisons, segmentation, and drill-downs can be more valuable than constant refresh.
Strategic dashboards usually operate on a longer reporting cycle. Leadership teams reviewing quarterly performance do not need to see every operational event. They need meaningful movement over the selected period, together with enough context to distinguish a temporary fluctuation from a sustained change.
Information density
Information density should reflect how users read and act on the dashboard.
Operational dashboards should answer a small number of urgent questions quickly. They should prioritize current status, exceptions, and immediate priorities while keeping secondary details behind a filter, panel, or drill-down.
Analytical dashboards can support greater density because investigation is the primary task. Users may need several comparisons, filters, segments, and levels of detail to understand why a result changed.
Strategic dashboards should present an aggregated overview of performance across business units, markets, or periods. They should avoid overwhelming decision-makers while preserving a path to supporting detail through filters, drill-downs, or linked reports.
Alerting
Alert behavior should reflect the user’s expected response.
On an operational dashboard, an alert may signal a condition that requires immediate intervention, such as a stopped machine, an overdue task, or a service-level breach.
On an analytical dashboard, an alert is more likely to identify an anomaly or unexpected difference that requires investigation. The user may need to compare periods, segments, or contributing factors before taking action.
On a strategic dashboard, an alert may highlight a material change in performance, a risk to a target, or a sustained trend that requires leadership attention.
Not every change should generate an alert. If the user cannot reasonably act on a notification, it may create noise rather than support decision-making.
Role permissions
Permissions should follow the actions users are expected to take. Different users may work with the same underlying data but have different rights to view, edit, assign, or act on it.
An operational dashboard may separate users who monitor a process from those who can assign work or change system settings. Analytical dashboards may provide access to filters, detailed records, or exports while limiting data-management permissions. Strategic dashboards may provide senior leaders with cross-functional visibility while restricting access to sensitive underlying information.
Permission design should therefore be based on role and responsibility, not simply on the dashboard’s intended audience.
A second cut: Business dashboards by function
Business dashboards can also be classified by the business function they serve. Common examples include data visualization, business intelligence, analytics, and marketing dashboards.
These labels describe a different dimension from the operational, analytical, and strategic categories:
- The functional label explains what the data is about.
- The decision-oriented label explains what the user is trying to do with the data.
For example, a marketing dashboard can be operational when it monitors active campaigns, analytical when it investigates channel performance, or strategic when it tracks quarterly growth against targets.
Data visualization dashboards are designed to make patterns in a dataset easier to recognize. They can help users identify trends, comparisons, distributions, and exceptions without reading through raw records.
Data visualization is not a separate decision category. It is a way of communicating information that can support operational, analytical, or strategic dashboards. An analytical marketing dashboard might use visualizations to compare campaign performance, while a strategic finance dashboard might use them to show revenue movement across markets or periods.
Business intelligence dashboards integrate data from multiple organizational sources and provide a shared view of performance. Their underlying systems may include data warehouses, reporting tools, data models, and access controls.
BI dashboards can support all three decision-oriented types. A sales operations team may use one to monitor current pipeline activity, an analyst may use it to investigate regional performance, and an executive may use it to review revenue trends.
Analytics dashboards give users greater control over investigation. They may include filters, comparisons, segmentation, drill-downs, statistical analysis, forecasting, or predictive models, depending on the business need.
In finance, analytics dashboards can support market analysis and risk assessment. In healthcare, they can help teams examine patient data, identify changes in disease patterns, or evaluate treatment outcomes. These uses require appropriate data governance, privacy controls, and domain-specific validation.
Marketing dashboards bring campaign, audience, acquisition, website, and conversion information into a shared view. The metrics are specific to marketing, but the interface should still reflect the user’s decision horizon.
A marketing operations team may need frequent campaign monitoring, making an operational view appropriate. A growth team investigating channel performance may need an analytical interface with comparisons and segmentation. A marketing leader reviewing performance across quarters may need a strategic view with aggregated trends, targets, and forecasts.
Finance, sales, healthcare, manufacturing, HR, and customer support can all use multiple dashboard types. The functional label identifies the subject of the data, while the operational, analytical, or strategic label identifies the user’s task.
How to tell which business dashboards work for your team
Teams should choose a dashboard type by considering who will use the interface, how quickly they need to act, and what decision the dashboard must support.
Start with the decision horizon:
- If the user must act within minutes, an operational dashboard may be appropriate.
- If the user is explaining a pattern over days or weeks, an analytical dashboard may be more suitable.
- If the user is tracking progress against a target over a quarter or year, a strategic dashboard may be the right choice.
Next, identify the primary user and the decision they need to make. An operator, analyst, department head, and CFO may all need access to the same underlying data, but they should not automatically receive the same interface.
Finally, define what should happen after the user sees a change:
- If the user needs to take action, provide status information, alerts, and role-appropriate controls.
- If the user needs to investigate, provide filtering, comparison, segmentation, and drill-down.
- If the user needs to assess progress, prioritize targets, trends, benchmarks, and meaningful deviations.
Use the following questions to determine which dashboard model best fits the team’s needs.
The answers do not need to fall entirely into one column. A product may contain several dashboard views, each designed for a different role or decision horizon. However, if most answers fall into one column, that provides a strong starting point for defining the interface.
Where teams get the type wrong
Teams often build the wrong dashboard by starting with the capabilities of an existing tool instead of the needs of the people who will use it. Another common mistake is classifying the dashboard by department and then expecting different users to work from the same view.
The most common failure is using an analytical dashboard for operational work. A drill-down-heavy screen with numerous filters may look impressive in a demonstration, but it can slow down a warehouse supervisor who needs to identify and resolve an active exception.
A second failure occurs when every user receives the same information. A single shared dashboard may appear efficient, but it can force users to navigate through details that are irrelevant to their work.
A third failure is scope creep. An interface that begins as an operational dashboard may accumulate strategic KPIs and historical reports over time as more stakeholders request additions. Eventually, the screen may become too complex for operational users while remaining too shallow for strategic decision-makers.
A fourth failure is placing every available KPI on the opening screen. The availability of a metric does not make it relevant. A useful test is to ask what the user would do differently after seeing each metric. If the answer is unclear, the metric may belong behind a filter, secondary view, or report.
The fifth failure is treating real-time data as automatically better. Current data is valuable when the decision depends on current conditions. It adds less value when the user is evaluating weekly trends, historical performance, or long-term targets.
Choosing the dashboard type is a product and information-architecture decision that should happen before visual styling and component selection. See Fuselab Creative’s broader dashboard design work for related implementation considerations.
Conclusion
The right dashboard begins with the user’s decision, not with a collection of available charts or KPIs. Before choosing the visual design, define who will use the interface, how quickly they need to act, how current the data must be, and what should happen when conditions change.
Operational, analytical, and strategic dashboards can use the same underlying data while presenting it in very different ways. Matching the interface to the user’s task makes the dashboard easier to scan, more relevant to the workflow, and more likely to remain useful after launch.
Frequently asked questions
What are business dashboards?
Business dashboards are interfaces that bring important metrics from one or more systems into a focused view. They are designed for a specific role, monitoring task, or decision. A practical framework groups them into operational, analytical, and strategic types.
What is the difference between operational and analytical dashboards?
Operational dashboards focus on current conditions and help users respond. Analytical dashboards provide more historical context, filtering, comparison, and detail so users can investigate why a change occurred.
Can one dashboard be both operational and analytical?
Yes. A product can combine different dashboard types, but the interface should make each job clear. For example, a platform may provide a live operational view for monitoring and separate analytical views for investigating the patterns behind those events.
How much do business dashboards cost?
The cost depends on the number of data sources, integrations, user roles, permission levels, interface complexity, and analytical requirements. A simple reporting view and a real-time enterprise dashboard are different projects, so a meaningful estimate requires defining the intended use and technical scope first.
How long does it take to create business dashboards?
The timeline depends on the data environment, number of users and roles, integrations, metric definitions, and required interactions. A dashboard that uses an established dataset and a clearly defined set of metrics can be delivered more quickly than one requiring new data connections, complex permissions, or advanced analytical capabilities.
How do I choose the right dashboard type?
Start with the user’s decision horizon. Operational dashboards support immediate monitoring and response, analytical dashboards support investigation, and strategic dashboards support long-term evaluation. Then define the required data freshness, information, permissions, and actions.
Should different teams have different dashboards?
Different teams may need different views even when they work with the same underlying data. Operations may need current status and alerts, analysts may need detailed exploration, and leadership may need aggregated performance trends and targets.