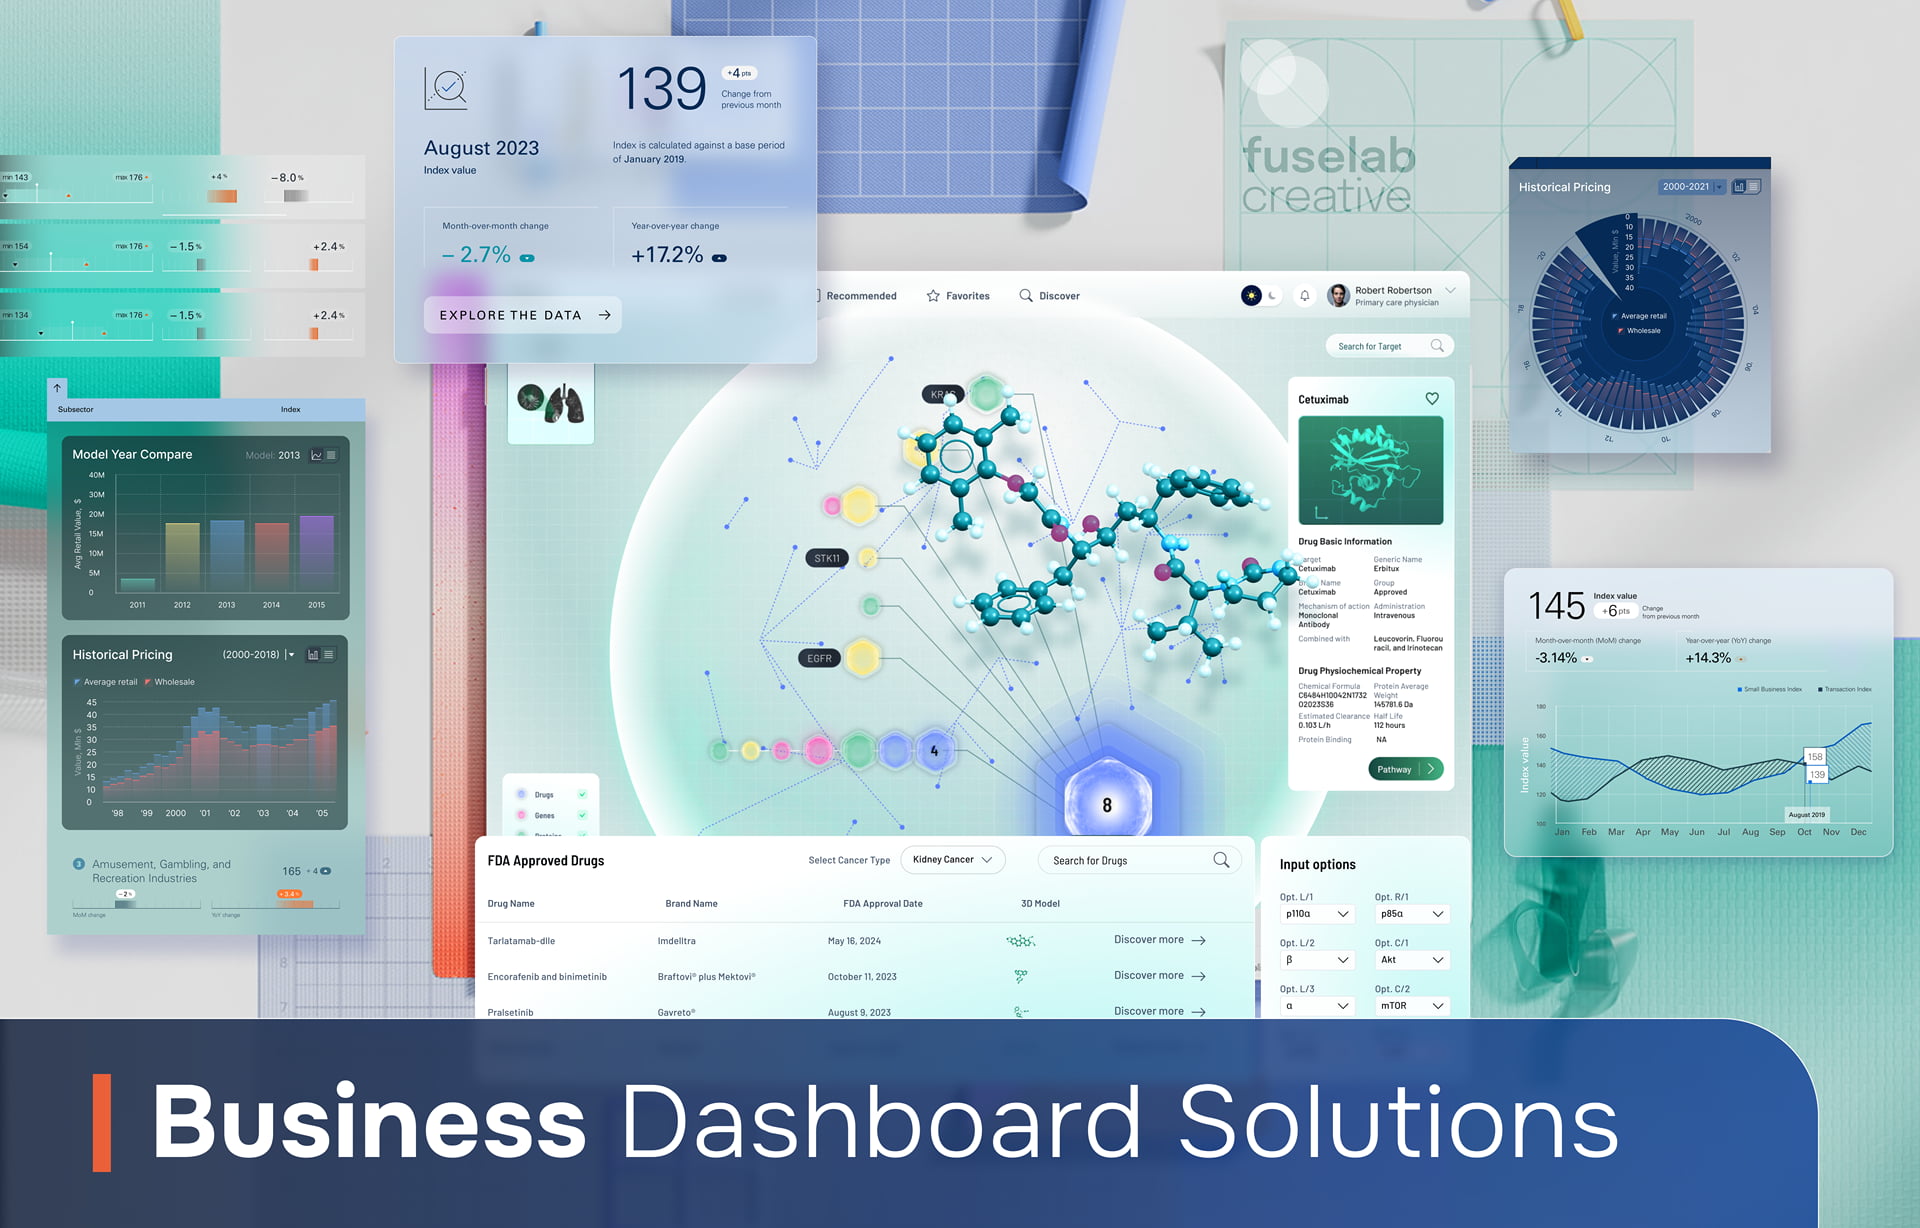
Business Dashboard Solutions Done Right: A Guide to Creating Effective Business Tools
What if the next time you plan a campaign launch, you have a tool that tells you everything that went right and wrong with your last campaign? What if you had clear visuals to present to your leadership board highlighting your successful record with total visual clarity? Or, what if all you had to monitor sales and marketing efforts was to draw up easy-to-understand graphics?
A business dashboard makes all of these hopes and dreams possible. Think of it as a visual tool that captures relevant statistics in real time and helps you make sense of it clearly and concisely. The steering wheels for data-driven decision-making, dashboards can be customized to meet the specific needs of different departments and roles. No more relying on intuition, guesswork, or word-of-mouth. The business dashboard can give you a centralized view of critical metrics, identify patterns, measure progress toward specific goals, and even do predictive analytics as to when you might reach your next round of benchmarks.
Despite the numerous benefits, creating effective business dashboards can be challenging. Integrating data from multiple sources, cleaning and standardizing it, and ensuring its accuracy and reliability – this can all turn out to be a hurdle without the right knowledge. This manual-like blog explores the fundamentals of business dashboards along with a step-by-step guide to creating them for the most effective outcomes.
Understanding a Business Dashboard Solution
Before we learn to effectively leverage business dashboards, it is important to understand the underlying concept of business intelligence (BI).
BI involves data collection for analysis and interpretation to support decision-making. Successful businesses rely on BI principles for advanced dashboard solutions that help meet their unique needs and goals.
What is a Business Dashboard?
What is a dashboard in business and how can it help me? Put simply, a business dashboard solution is a visual tool that provides a real-time snapshot of key performance indicators (KPIs) and other relevant metrics within an organization. This is something that used to require the effort of multiple staff members collecting and collating data and then presenting it in some kind of report format. You can rely on a business dashboard to present data clearly and concisely, transforming complex data into easy-to-understand graphics. The result is that stakeholders can quickly understand the current state of the business and identify areas for improvement in minutes.
The Benefits of Dashboard Business Analytics
Business dashboards offer a multitude of benefits for businesses, and decision-making support is just one of them. You can use a dashboard to improve business performance, achieve organizational goals in a focused, targeted manner, and share quantitative outcomes without complicating your highlights. Let us dive into each benefit a little further.
Improved Decision Making
Dashboards offer actionable insights to inform decision-making at all levels of your organization. For instance, departmental managers can visualize data and trends to identify opportunities, assess risks, and make data-driven decisions. This paves the way for better outcomes, reduced costs, and more profitability.
For instance, the Aircraft Bluebook dashboard we created is widely trusted by insurance and finance professionals for enhanced decision-making capabilities, and by those looking to add to their corporate or personal aircraft fleet.
Enhanced Efficiency
Another one of the business dashboard benefits lies in its ability to streamline processes and reduce manual tasks. Business dashboards often help automate data collection, analysis, and reporting. This can free up employees to focus on more value-added activities instead. Besides, dashboards can help identify bottlenecks and ineptness in various processes, directly helping organizations optimize workflows and improve efficiency.
Increased Productivity
Dashboards paint a clear picture of key metrics and hence prove most valuable in helping teams work more efficiently. For instance, employees will no longer need to waste time in identifying areas that call for more focused efforts. They can easily track progress toward goals the manager has set for them, and in many cases, this is done in real time. This translates to boosted productivity, morale, and results.
Better Collaboration
A business intelligence dashboard also fosters collaboration and alignment among teams. Think of a platform any employee, manager, or director can visit to get a shared understanding of the business’s performance. Dashboards make it possible to visualize these data and insights, helping teams identify areas where they need to work together, coordinate their efforts, and ensure progress toward joint goals.
Improved Customer Satisfaction
A dashboard for business can help better understand and meet customer needs by providing insights into customer behavior, preferences, and satisfaction levels. By tracking customer metrics such as satisfaction ratings, customer churn, and net promoter scores, organizations can identify areas for improvement and take steps to enhance the customer experience.
The benefits of dashboards can extend well beyond these advantages on a use-case basis. Read this blog on How Dashboards Help Create Smart Leadership to learn more.
What Goes into a Business Dashboard: Key Components
A well-designed business dashboard is like an effective machine – there are several key components at work together to give you the desired outcome. For a dashboard, these components include the title and overview, key performance indicators (KPIs), charts and graphs, filters and slicers, drill-down functionality, and alerts and notifications.
Each component is vital to ensuring that the dashboard meets the needs of its users.
#1 Dashboard Title and Overview
The dashboard title should clearly convey the dashboard’s purpose and focus. Pro tip: Pick a concise and informative title so users can quickly understand the content and navigate to the relevant sections.
The overview section comes next, with a brief summary of the key metrics and visualizations the dashboard includes. Again, the information here should be brief, relevant, and guide users towards the areas of interest.
#2 Key Performance Indicators (KPIs)
KPIs are the most critical metrics that measure the performance of a business, and hence the most important components of a business dashboard. They should be aligned with the organization’s goals and objectives, displayed prominently using large, easy-to-read numbers or charts, and be relevant to the target audience.
#3 Charts and Graphs
Visualizations are key to a business management dashboard, helping present the data as concisely as possible. Displaying trends, patterns, and data relationships becomes easier with charts and graphs, and dashboards typically offer an impressive variety of line charts, bar charts, pie charts, scatter plots, and heatmaps to choose from. Think of the type of data you wish to present and the desired level of detail before picking one chart type.
For instance, our QGen Health Lab dashboard solution combines an intuitive interface with advanced algorithms for thorough analysis.
#4 Filters and Slicers
Filters and slicers allow users to customize the dashboard to their specific needs. Users can drill down into the data and focus on specific subsets of information, applying filters to various dimensions like time, location, product category, or customer segment. Slicers, on the other hand, help create multiple views of the same data, so you can easily compare different scenarios or analyze the impact of various factors.
#5 Drill-Down Functionality
Dashboard business analytics also offer a drill-down functionality for users to explore the data in more detail. Simply click on specific data points to investigate underlying trends, identify outliers, and uncover hidden patterns. Drill-down can be implemented at different levels, from high-level summaries to granular details.
#6 Alerts and Notifications
A modern, more convenient addition to business dashboards, alerts and notifications can be used to update users on important events or data changes. This is particularly useful for monitoring critical KPIs. Alerts can be triggered by various conditions, such as exceeding or falling below target values, detecting anomalies, or reaching predefined thresholds. Notifications can be sent via email, text message, or within the dashboard itself.
Types of Business Dashboard Solutions
The market for business dashboard solutions is vast and diverse, meaning multiple options to meet the needs of organizations of all sizes and industries. This makes picking one all the more difficult. Here are the broad types of business dashboards to help you make an informed choice:
Open-Source vs. Proprietary Solutions
Open-source dashboard solutions are available for free. They can be modified or customized to meet the specific requirements of your organization. Open-source solutions often offer a high degree of flexibility and control. However, you might need additional technical expertise to implement and maintain them. If you are looking for a small business analytics dashboard, an open-source solution is something you can consider.
Proprietary solutions, on the other hand, are developed and sold by commercial vendors. They typically offer a more comprehensive feature set and dedicated support. While they may be more expensive, they often provide a more streamlined and user-friendly experience, providing more of what you are looking for.
Cloud-Based vs. On-Premise Solutions
A cloud-based digital dashboard for business is hosted on remote servers and accessed via the internet. Their benefits include scalability, accessibility, and lower maintenance costs. On-premise solutions are installed and managed on-site, which gives greater control over data security and privacy. However, they may require significant upfront investment and ongoing maintenance.
Selecting the Right Solution for Your Needs
The best business management dashboard solution for your organization will depend on your specific needs and priorities. The following are a few factors to consider when making your decision:
- Budget: Determine your budget for the digital dashboard business, including licensing costs, implementation fees, and ongoing maintenance expenses.
- Scalability: Make sure the solution can accommodate your organization’s growth and changing needs.
- Ease of Use: Pick a solution that is intuitive and easy for your team to use.
- Customization Options: Consider the level of customization you need for your business’s specific goals or requirements.
- Integration Capabilities: Examine the solution’s ability to integrate with other systems and data sources.
- Support and Maintenance: Explore the vendor’s support services and maintenance options.
For instance, the Fuselab Creative Fiserv Small Business Index solution is making data-driven understanding across all financial business sectors and regions, possible and was designed and developed with the above-listed features in mind.
Fortunately, the market is abuzz with several popular, high-performing business dashboard tools, each with its own USP and benefits:
- Tableau: Powerful, flexible data visualization, varied features, plenty of customization options.
- Microsoft Power BI: Advanced business intelligence tool, tightly integrated with the Microsoft Office suite.
- Qlik Sense: Self-service analytics platform, that helps users explore data and discover insights most effectively.
- Google Data Studio: Free cloud-based dashboard tool, with a simple and intuitive interface.
- Looker: Cloud-based data platform, advanced analytics, and visualization capabilities.
While this is just a small sample of the many dashboard tools available at your disposal, we advise researching all your options based on budget, use, and your specific needs for an informed choice.
Alternatively, if you are looking to create a custom dashboard for a small business, here are some essential dashboard interface design principles to consider.
Business Dashboard Design Principles
Designing effective business dashboards calls for a thoughtful, structured approach considering both technical and business factors. The following established design principles are your go-to when creating a business dashboard that is visually appealing, informative, and easy to use.
#1 Understanding Your Audience
The first step to designing a business dashboard is to have a clear understanding of the target audience. Consider the roles, responsibilities, and needs of the dashboard users, and then tailor the design and content to their specific requirements. This helps ensure that the dashboard gives just the information they need in a format that they find easy to understand and interpret.
#2 Defining Your Goals
Before you get down to designing a dashboard, it is important to define the specific goals and objectives that it will serve. What information do you want to convey? What actions do you want users to take based on the data presented? Articulate the goals of the dashboard clearly, and you can ensure a focused, effective design process.
#3 Choosing the Right Metrics
Selecting the right metrics is critical to dashboard design. Focus on relevant KPIs for the most meaningful insights. Avoid overwhelming users with too much data. Instead, prioritize the most important metrics and present them effectively using the dashboard.
#3 Keeping it Simple and Intuitive
A cardinal rule for a well-designed dashboard is that it should be easy to understand and navigate. Avoid clutter and excessive complexity. Use clear and consistent labeling with tooltips for unfamiliar terms. The dashboard should ensure a logical flow and a clear information hierarchy, making it easy for users to find the data they need.
#4 Using Visualizations Effectively
What is a dashboard for business analytics? Simply put, it’s a potent means of communicating data. Effective visualization makes this possible when chosen suitably for the type of data being presented. Some tips to follow: use consistent colors, fonts, and formatting for a visually appealing and cohesive dashboard. Avoid using too many different types of visualizations, lest the dashboard becomes confusing and difficult to understand.
#5 Ensuring Data Accuracy and Reliability
You are not favoring informed decision-making if you don’t ensure data accuracy and reliability, no matter how visually appealing the dashboard. Implement data validation and quality control measures to ensure the data is accurate and up-to-date. Regularly review and update your data sources for data integrity.
#6 Making it Interactive and Responsive
- The importance of a dashboard in business for a personalized experience cannot be overstated. Allow users to filter, drill down, and explore the data in different ways. Consider incorporating features like search bars, sliders, and drop-down menus to enable users to customize the dashboard to their specific needs. Also, ensure that the dashboard is responsive and can be viewed on devices like desktops, tablets, and smartphones alike.
For more insights, refer to this blog on Dashboard Design Trends for 2024 for a quick guide.
Creating a Business Data Dashboard
Now that we have covered what a dashboard design must incorporate, the next step is to understand how to create one. Creating a business dashboard involves several key steps for effective, informative, and aligned outcomes. Here is a step-by-step guide to follow:
Data Collection and Preparation
The first step in creating a business intelligence dashboard solution is to gather the necessary data. This may involve collecting data from multiple sources, such as databases, spreadsheets, and external systems. Once the data is collected, it must be cleaned, standardized, and transformed into a format that is suitable for analysis. This may involve removing duplicates, correcting errors, and creating derived variables.
#1 Data Analysis and Visualization
Once your data is ready, the first step is to analyze it to identify trends, patterns, and insights. You may need to use statistical techniques, data mining algorithms, or other analytical methods for this purpose. The insights gained can then be visualized using charts, graphs, and other elements based on the type of data being presented and the desired level of detail.
#2 Dashboard Layout and Design
The dashboard layout and UX/UI design are critical to its effectiveness. For one, the dashboard should be visually appealing and easy to navigate, providing a clear overview of the data and how to customize the view to reach the user’s desired goals. Think of using a consistent color scheme, fonts, and formatting for familiarity. Make sure the design is logical and structured, and provide clear labels and explanations for all components.
#3 Testing and Iteration
Once the dashboard is designed, it needs thorough testing to ensure that it functions as intended. Test the dashboard on different devices and browsers, and check for errors or inconsistencies in the data. After testing, the dashboard may need to be revised and iterated upon to improve its effectiveness. Gather feedback from users continuously and adjust the design and components as needed when creating a business dashboard.
Exciting Business Dashboard Use Cases to Explore
The most interesting aspect of business dashboards is that they can be tailored to meet the diverse needs of business departments and functions. Here are some interesting use cases of business dashboards optimizing processes with their features:
Sales and Marketing Dashboards
Sales and marketing teams can use a business dashboard solution to track key metrics like sales revenue, lead conversion rates, customer acquisition costs, and market share. The dashboard can help analyze customer behavior, identify target markets, and measure the effectiveness of their marketing campaigns. Visualizing sales data and performance metrics effectively can uncover key trends, areas for improvement, and the roadmap to optimized sales and marketing strategies for teams.
Finance Dashboards
Finance teams can use dashboards to monitor financial performance, track expenses, and analyze profitability. They can also be used to forecast revenue, manage budgets, and assess financial risk. The USP of dashboards lies in the real-time view of financial metrics they provide, helping finance teams identify potential issues, make informed decisions, and ensure the organization’s financial health on priority.
Operations Dashboards
Dashboards can prove most effective for operations teams to monitor production efficiency, track inventory levels, and measure quality control. They can help identify bottlenecks in processes, optimize resource allocation, and improve overall operational performance. Visualizing operational data effectively using dashboards also helps reduce costs and improve customer satisfaction.
Human Resources Dashboards
Human resources teams can leverage business dashboards to track employee turnover, measure employee satisfaction, and analyze recruitment and onboarding processes. Monitoring training and development programs, assessing employee performance, and identifying talent gaps become easier with these tools. Ultimately, these informed decisions can lead to improved employee retention, enhanced productivity, and a positive work environment.
Customer Service Dashboards
Customer service teams can use dashboards to track customer satisfaction, measure response times, and analyze customer feedback. Dashboards can also be used to identify common customer issues and identify opportunities for process improvement. This can help improve customer satisfaction, reduce customer churn, and enhance the overall customer experience.
Advanced Dashboard Features
Apart from the core components and design principles we discussed, the modern business intelligent dashboard incorporates certain advanced features that take functionality and value up by several notches. With deeper insights, improved efficiency, and collaboration efforts, these advanced features are worth all the hype.
Predictive Analytics
Let your dashboard use historical data and statistical models to forecast future trends and outcomes using predictive analytics. You can identify potential risks and opportunities, make more informed decisions, and proactively address challenges using predictive models. Some specific use cases include forecasts on sales, customer churn, and financial performance.
Real-Time Data Updates
With real-time data updates, dashboards always display the most current information. This comes in handy for industries where rapid, unprecedented changes can make or break business operations. Dashboards with real-time update features enable organizations to respond quickly to changing conditions and make timely decisions.
Mobile Optimization
Mobile optimization ensures that dashboards can be accessed and used on mobile devices like smartphones and tablets. Many organizations today need to monitor key metrics and make decisions on the go. Mobile-optimized dashboards are the perfect fit, designed to provide a seamless user experience.
Collaboration and Sharing
Collaboration and sharing features allow users to work together on the business digital dashboard, share insights, and team up on decision-making. This is particularly useful for teams that must coordinate their efforts or share updates with multiple stakeholders. Dashboards these days include features like commenting, annotations, and dashboard sharing to facilitate this.
Integration with Other Systems
Dashboards nowadays can be integrated with other systems like CRM, ERP, and BI tools for a more comprehensive business overview. Streamline workflows, reduce data silos, and improve decision-making with these complex but thoughtfully designed dashboards.
Conclusion
Business dashboards have become essential tools today for organizations that want to make data-driven decisions, improve efficiency, and enhance their overall performance. This guide outlines the design principles and best practices for a visually appealing, informative, and easy-to-use dashboard.
The business landscape is dynamic and ever-evolving, making data-driven decision-making all the more important. Companies should consider investing in effective business dashboards for a competitive advantage and to achieve their strategic goals. Even if you do not have in-house capabilities to develop a solution that is optimized and valuable, you can hire professionals to help get the business management dashboard that matches your goals.
At Fuselab Creative, we specialize in crafting business dashboard solutions that not only meet these requirements but come with advanced features for future-proofing our work to grow with your organization. Your search for a one-stop destination for business dashboard design solutions ends here!
Together, we can develop a data dashboard development plan that will advance your company from concept to launch! Work with us to build a comprehensive dashboard solution, from concept to launch, and help your business reach ridiculously exciting heights! For further information, get in touch with our Software Design Service team.