Hyperfab AR Interface and Robotics Dashboard Design
Fuselab delivered UX research, UI/UX design, and animation for Hyperfab, a native industrial application used by construction crews building walls for commercial buildings. The primary interface runs on augmented reality goggles alongside a desktop dashboard.
Hyperfab is a native application built for industrial robotics environments. Operators interact with it through augmented reality goggles on the factory floor and a desktop dashboard for planning and monitoring. Fuselab’s scope covered UX research, UI/UX design, and animation for the existing product. All designs have been implemented and are actively used in commercial construction environments today.
We worked with Fuselab on multiple projects, and each time they took care to detail our needs. The designs they produced were thoughtful and visually striking. They especially have a very talented illustration team, and we enjoyed the many illustrations they produced for us. They have fair pricing, fast response time, and a full team of talented UI/UX designers.
Factory
Performance
Overview
Industrial Interface Design for Factory Environments
Factory interfaces operate in an environment where a misread status indicator can stop a production line. Hyperfab’s dashboard uses color coding that follows universal industrial conventions: green for normal operation, yellow for warning states, red for critical alerts. Typography is sized for readability at distance and under variable lighting conditions. Information is grouped by operational function rather than data type, so operators can locate what they need at a glance without reading through unrelated metrics. These are not aesthetic decisions. They are functional requirements for an interface that runs on a live production floor.


AI Simulation Interface for Robotic Process Preview
The AI simulation interface allows operators to preview robotic processes before executing them. Using a prompt-based input, users can simulate cutting, labeling, or assembly operations and view a detailed animation of the motion path, including the full arc of a cutting arm, with timeline controls and playback tools. Fuselab designed the animation layer for this feature. The ability to visualize a robotic operation before it runs reduces setup errors and gives operators a way to verify configurations without a physical test run. Fuselab’s experience with simulation interface design informed how this feature was structured for operator use in a live industrial environment.


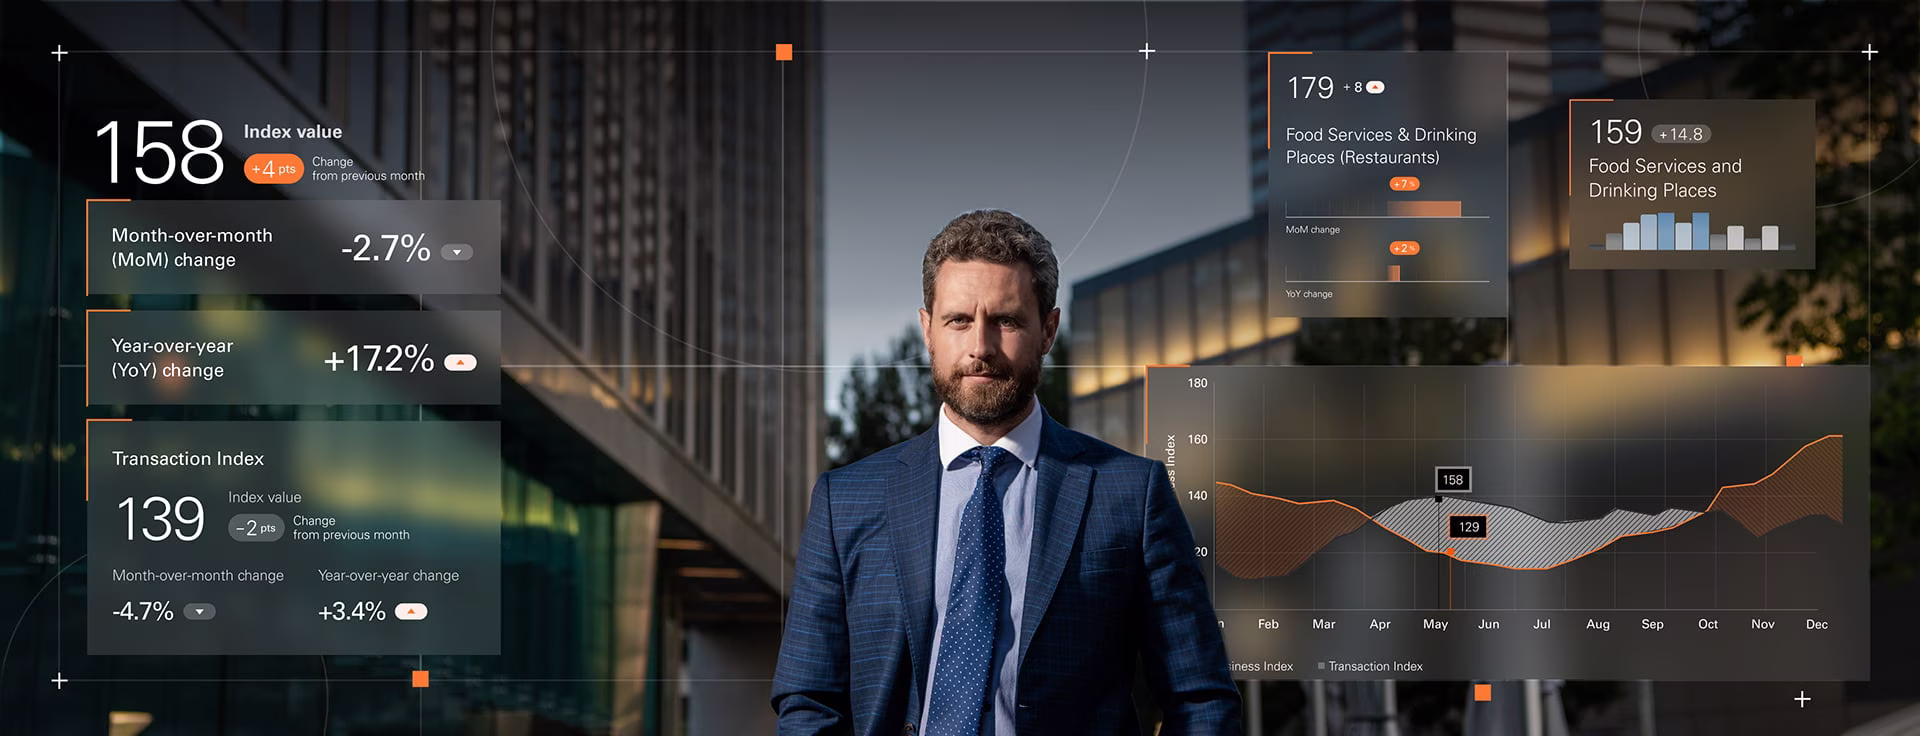
Equipment Performance Tracking Across the Production Floor
The equipment tracking layer shows how each robotic unit is performing individually and how the full fleet is performing collectively. Real-time metrics allow direct comparison between actual output and target output at the unit level and at the floor level simultaneously. Historical and monthly trend views give production managers the context to distinguish between a short-term variance and a longer-term performance pattern.
This chart highlights the monthly progression of all the active equipment outputs, comparing actual performance to preset operational targets. Users can easily and quickly identify trends, evaluate seasonal shifts in productivity, and monitor how effectively equipment is meeting performance expectations across the year.
This production monitoring robotics dashboard design graphics provide managers with a comprehensive view of equipment health and usage. The OEE graph breaks down Performance, Quality, and Availability metrics hour by hour—helping diagnose inefficiencies at the root.

Device Calibration and Real-Time Robotic Control
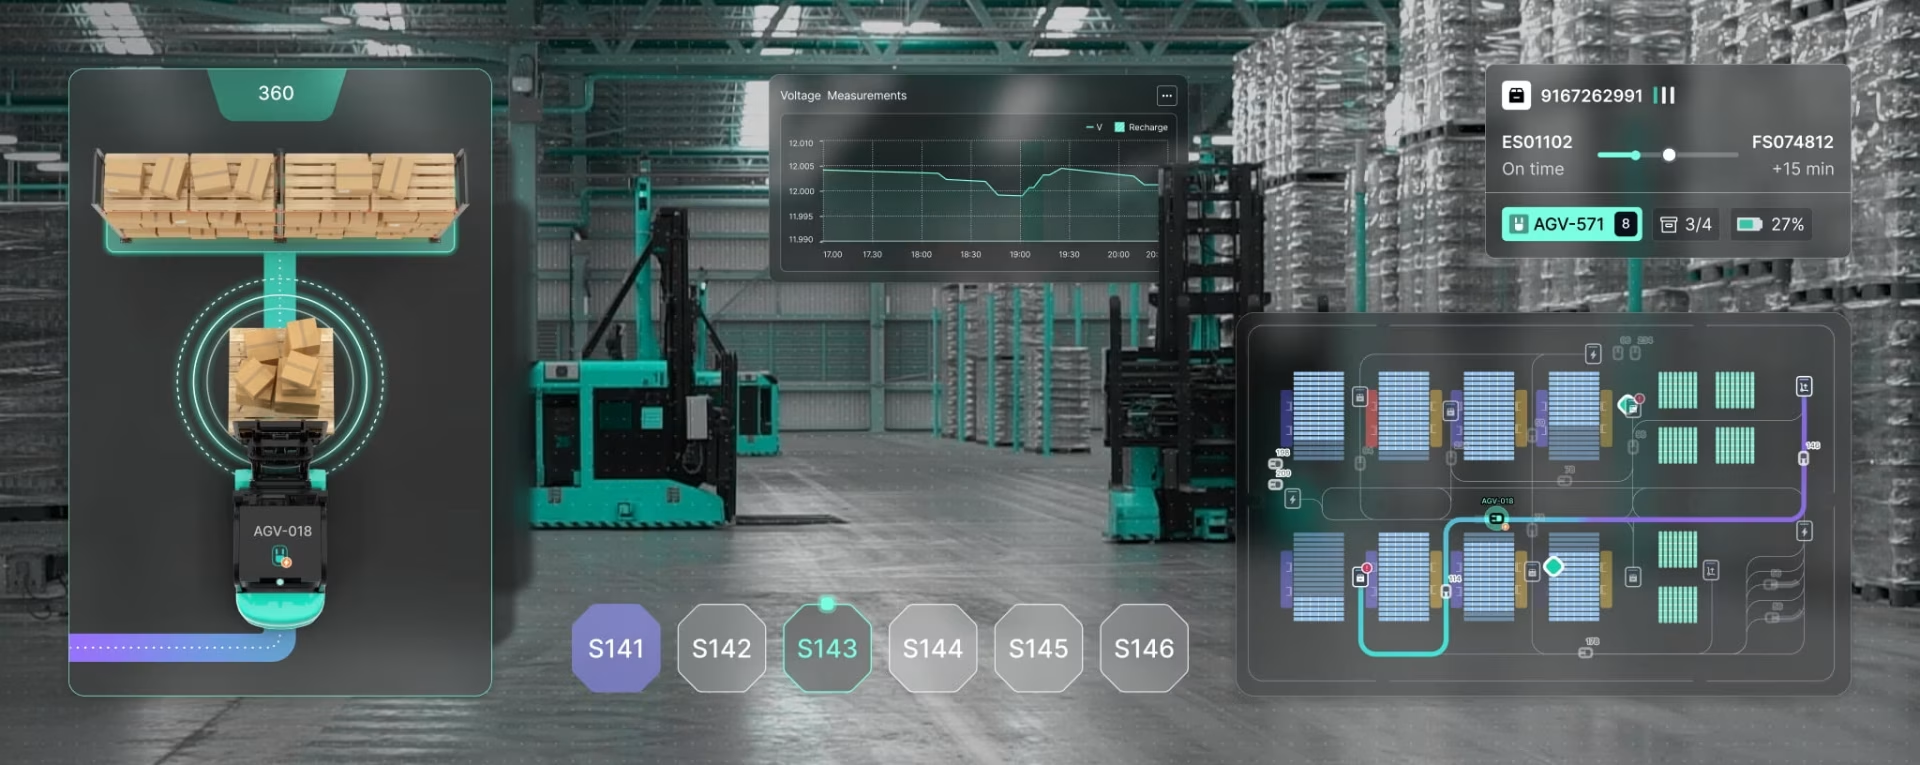
Operators can select individual devices by type, including Cutting, Riveting, and Labeling units, and make real-time adjustments to positioning, rotation, and assignment directly from the interface. An interactive 3D model provides immediate visual feedback during calibration so operators can confirm adjustments are accurate before resuming production. The 3D model is also part of the AR goggles experience, allowing operators on the floor to interact with a spatial representation of the equipment they are working with rather than reading from a flat screen at a distance.

Real-Time Robotic Arm Monitoring During Live Operations
The monitoring interface gives operators real-time oversight of robotic arm performance during cutting operations along the conveyor line. A top-down visualization shows exact tool movement with instant controls for Free Run, Pause, and Stop states. Iconography, color-based indicators, and spatial cues allow a manager to assess the state of an entire operation in a single glance rather than reading through sequential status fields. The same visual language is consistent across the desktop dashboard and the AR goggles interface, so operators moving between both surfaces do not need to relearn the interface as they change contexts. See how Fuselab approaches industrial interface design for environments where split-second clarity is a safety and productivity requirement.
Reading a robotic arm’s status from a data table takes seconds. Reading it from a color-coded indicator with the right iconography takes a fraction of a second. In a live production environment that difference matters. Hyperfab’s machine performance indicators were designed so a floor manager can assess the operational state of every active unit in a single visual scan, without stopping to interpret text or numerical readouts. The same indicator system works identically on the desktop dashboard and through the AR goggles, so operators get consistent information regardless of which surface they are using.

Designed by:
Art Direction
George Railean
Project management
Vladimir Bobu
Design
Lina Ghimp, Vitalie Ghimciuc
Robotics Dashboard Design and AR Interface: Common Questions
What is robotics dashboard design?
Robotics dashboard design is the practice of creating interfaces that give factory operators, floor managers, and production teams real-time visibility into the performance, status, and output of robotic systems. It differs from standard dashboard design because the users are working in physically demanding, time-pressured environments where a misread status indicator can stop a production line or create a safety issue. The interface must surface critical information at a glance using universally understood visual conventions, present actual versus planned output simultaneously, and support direct control actions such as pausing, resuming, or recalibrating equipment. Hyperfab is a live example of this type of interface, currently used by construction crews building walls for commercial buildings across a desktop dashboard and an augmented reality goggles interface.
What does it mean to design an interface for augmented reality goggles in an industrial environment?
Designing for augmented reality goggles in a factory environment means the interface is not displayed on a screen the operator walks to. It is overlaid directly onto the operator’s field of view while they are physically working near the equipment. This changes every design decision. Typography must be readable while the operator is in motion. Visual indicators must be distinguishable under variable lighting conditions including bright factory floors and shadowed workspaces. Interactive elements must be operable without a traditional input device. The information density must be lower than a desktop dashboard because the operator cannot stop to read. For Hyperfab, Fuselab designed a visual language that works consistently across both the AR goggles interface and the desktop dashboard, so operators moving between both surfaces encounter the same indicators, the same color system, and the same control conventions without relearning anything.
How is AI simulation used in a robotics interface?
AI simulation in a robotics interface allows operators to preview a robotic process before executing it. Rather than running a physical test, an operator enters a prompt describing the operation, and the system generates a detailed animation of the motion path, including the full arc and timing of each robotic action. Hyperfab’s AI simulation feature covers cutting, labeling, and assembly operations. Each simulation includes timeline controls and playback tools so operators can step through the motion frame by frame and verify positioning before committing to a live run. Fuselab designed the animation layer and the interface that presents the simulation to the operator. The ability to visualize a robotic operation before it runs reduces setup errors and gives operators a way to verify configurations in the interface rather than on the production floor.
Why does color coding matter more in factory interfaces than in other dashboards?
In a standard analytics dashboard, a user who misreads a color indicator can re-examine the data. In a factory environment, a floor manager who misreads a status indicator during active production may not have time to look again before a problem compounds. Factory interfaces use color systems derived from industrial safety conventions: green for normal operation, yellow for warning states requiring attention, red for critical alerts requiring immediate action. These conventions are not aesthetic choices. They are communication standards that operators already know from other industrial systems. Introducing non-standard color usage in a factory interface forces operators to consciously decode rather than instantly recognize, which adds cognitive load at exactly the moment it is least affordable. Hyperfab’s interface uses this conventional system consistently across every status display, from individual robotic arm indicators to floor-level operational overviews.
What is OEE and how is it used in a robotics dashboard?
OEE stands for Overall Equipment Effectiveness, a standard manufacturing metric that measures how productively a piece of equipment is being used relative to its full potential. It breaks down into three components: Availability, which measures the percentage of scheduled time the equipment is actually running; Performance, which measures whether the equipment is running at its designed speed; and Quality, which measures the percentage of output that meets specification without rework. In Hyperfab’s dashboard, the OEE graph presents all three components hour by hour, giving production managers a granular view of where efficiency is being lost within a shift rather than only seeing an aggregate figure at the end of the day. This level of detail allows managers to diagnose whether a slowdown is caused by downtime, speed loss, or quality issues, which determines the correct response.
What does real-time robotic calibration require from the interface?
Calibration in a robotics interface requires the operator to select a specific device, view its current position and orientation in a spatial context, make adjustments, and confirm the result before the equipment resumes operation. The interface needs to support all of these steps without the operator leaving the calibration view or switching between screens. For Hyperfab, Fuselab designed a calibration interface where operators select individual devices by type, including Cutting, Riveting, and Labeling units, and adjust positioning, rotation, and assignment directly from a single view. An interactive 3D model updates in real time as adjustments are made, giving operators immediate visual confirmation that the change has been applied correctly. The 3D model also forms part of the AR goggles experience, allowing operators to interact with a spatial representation of the equipment while physically standing near it.
Does Fuselab design and develop robotics interfaces or only design them?
For Hyperfab, Fuselab’s scope covered UX research, UI/UX design, and animation. The product’s development was handled by Hyperfab’s internal team. Fuselab delivered all design assets, interaction specifications, and animations to a standard that allowed direct implementation. All designs have been implemented and are currently live in commercial use. For clients who have their own development team, Fuselab delivers a complete set of design documentation, component specifications, and animation assets that engineers can build from without a design-to-development translation gap. For clients who need design and development under one engagement, Fuselab also handles full product builds including backend development and API integration.
Robotics Dashboard Design - Interested in creating something similar?
Related Services and Solutions
Don't Listen to Us, Read What Our Clients Are Saying.
We know that trusting an outsider with your vision can be scary. This is why if you're not satisfied with us after the first two weeks, you can walk away owing us nothing.
"We went from prototype to usable software lightening fast, and our customer reviews have never been better."
"Their creativity and mastery of UX UI design has made our years of working together enjoyable and incredibly successful!"
"If you need to re-think your product and need some truly unique design talent , Fuselab Creative design team is your answer."
"We needed a nimble team of UI UX designers to work with our development team and they quickly became one of our most vital resources and far exceeded our expectations."