Agents Management

Industries:
Description:

Agents Management is an AI agent dashboard for monitoring, troubleshooting, and governing an entire fleet, with goals, spend, rules, evidence, and physical sites in one live view.
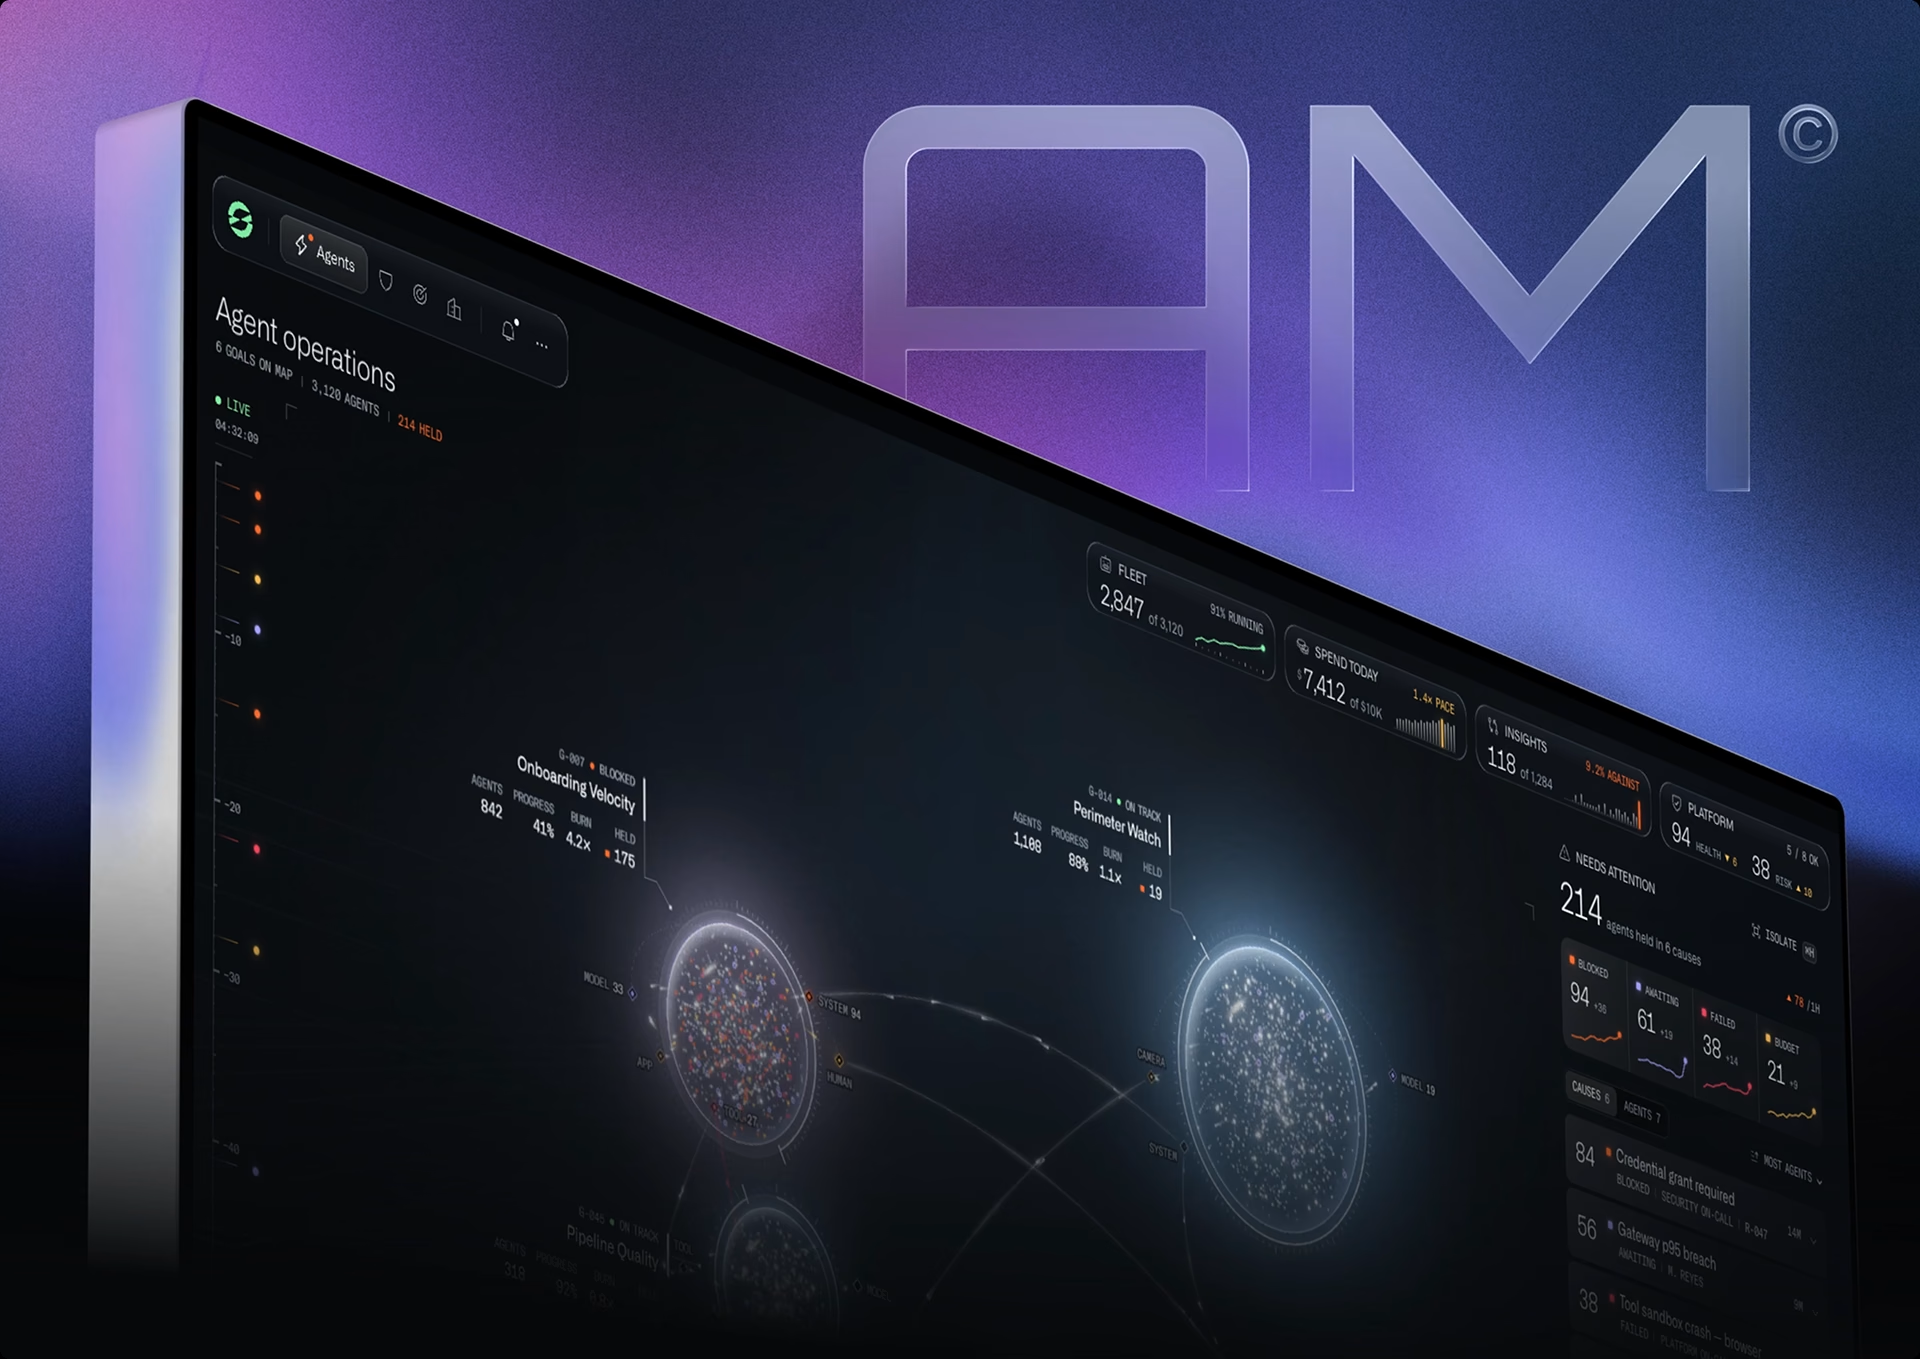
AI agents only pay off when operators can see them. Agents Management shows every agent in the fleet, the goal it is working toward, and the reason it stopped, as it happens rather than hours later in the logs.

Scope \ The challenge

A stalled agent costs hours. Spot it, and the fix takes minutes.

Most agent tools trace one run at a time, so teams found held agents by digging through logs, often hours later. Operators needed the whole fleet and every blocker in one view.

Before
• Held agents hidden in run logs
• Blockers found by hand, hours later
• No single view of the fleet

After
• Held agents grouped by root cause
• One fix releases dozens at once
• The whole fleet in one live view

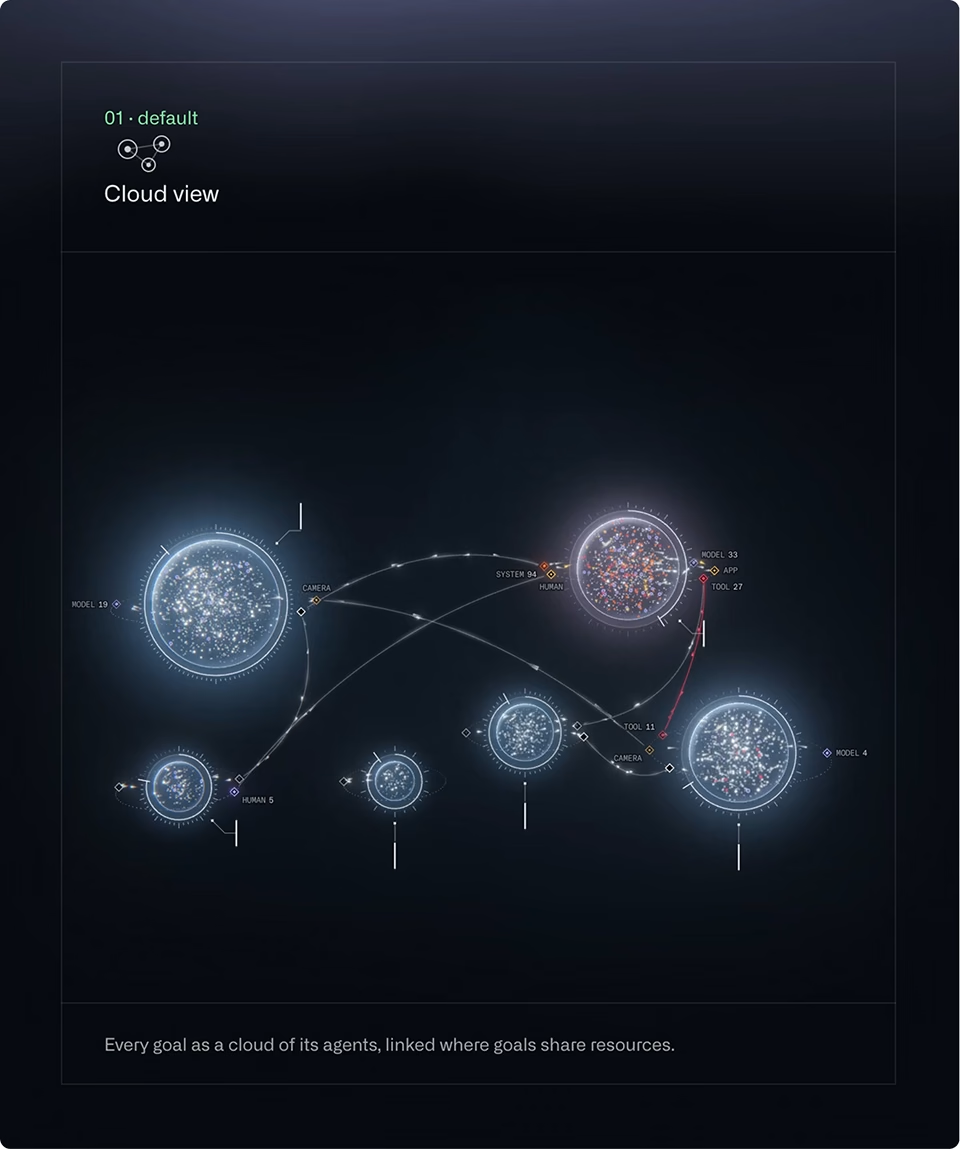
Live Fleet Map

Every goal drawn as a live cloud of its agents, across the whole fleet, so operators can spot trouble before reading a single log.

Needs Attention

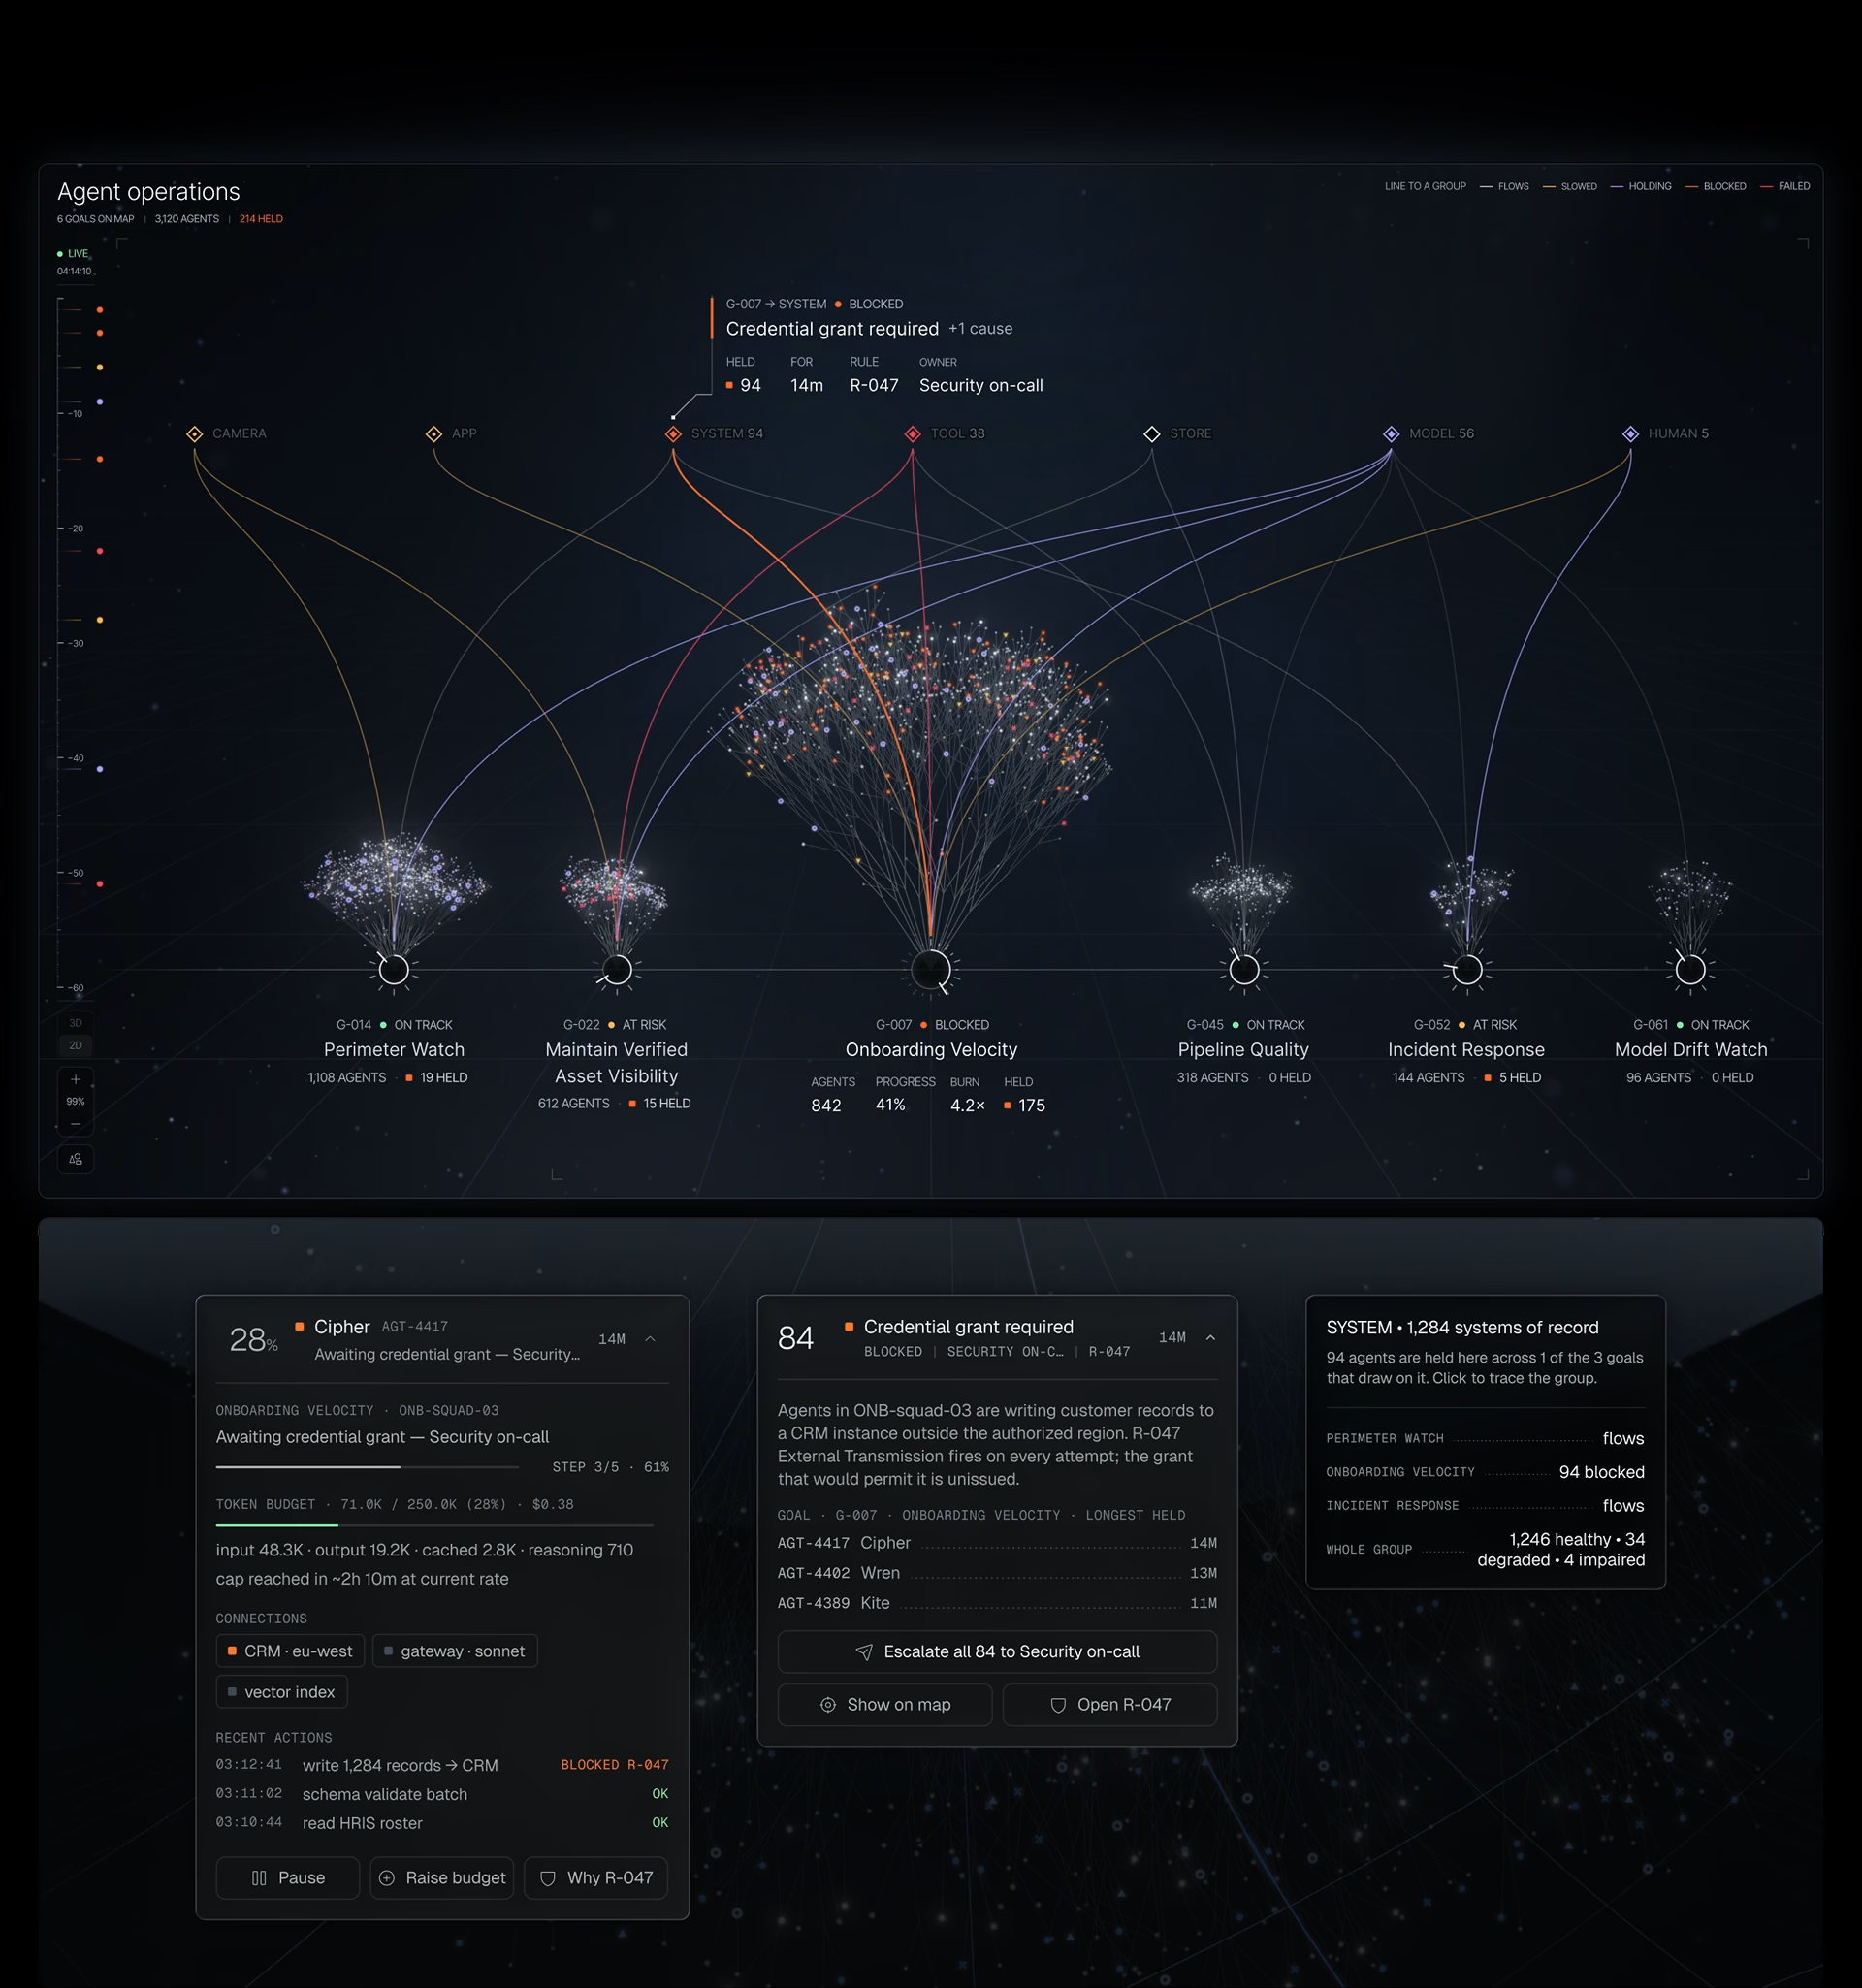
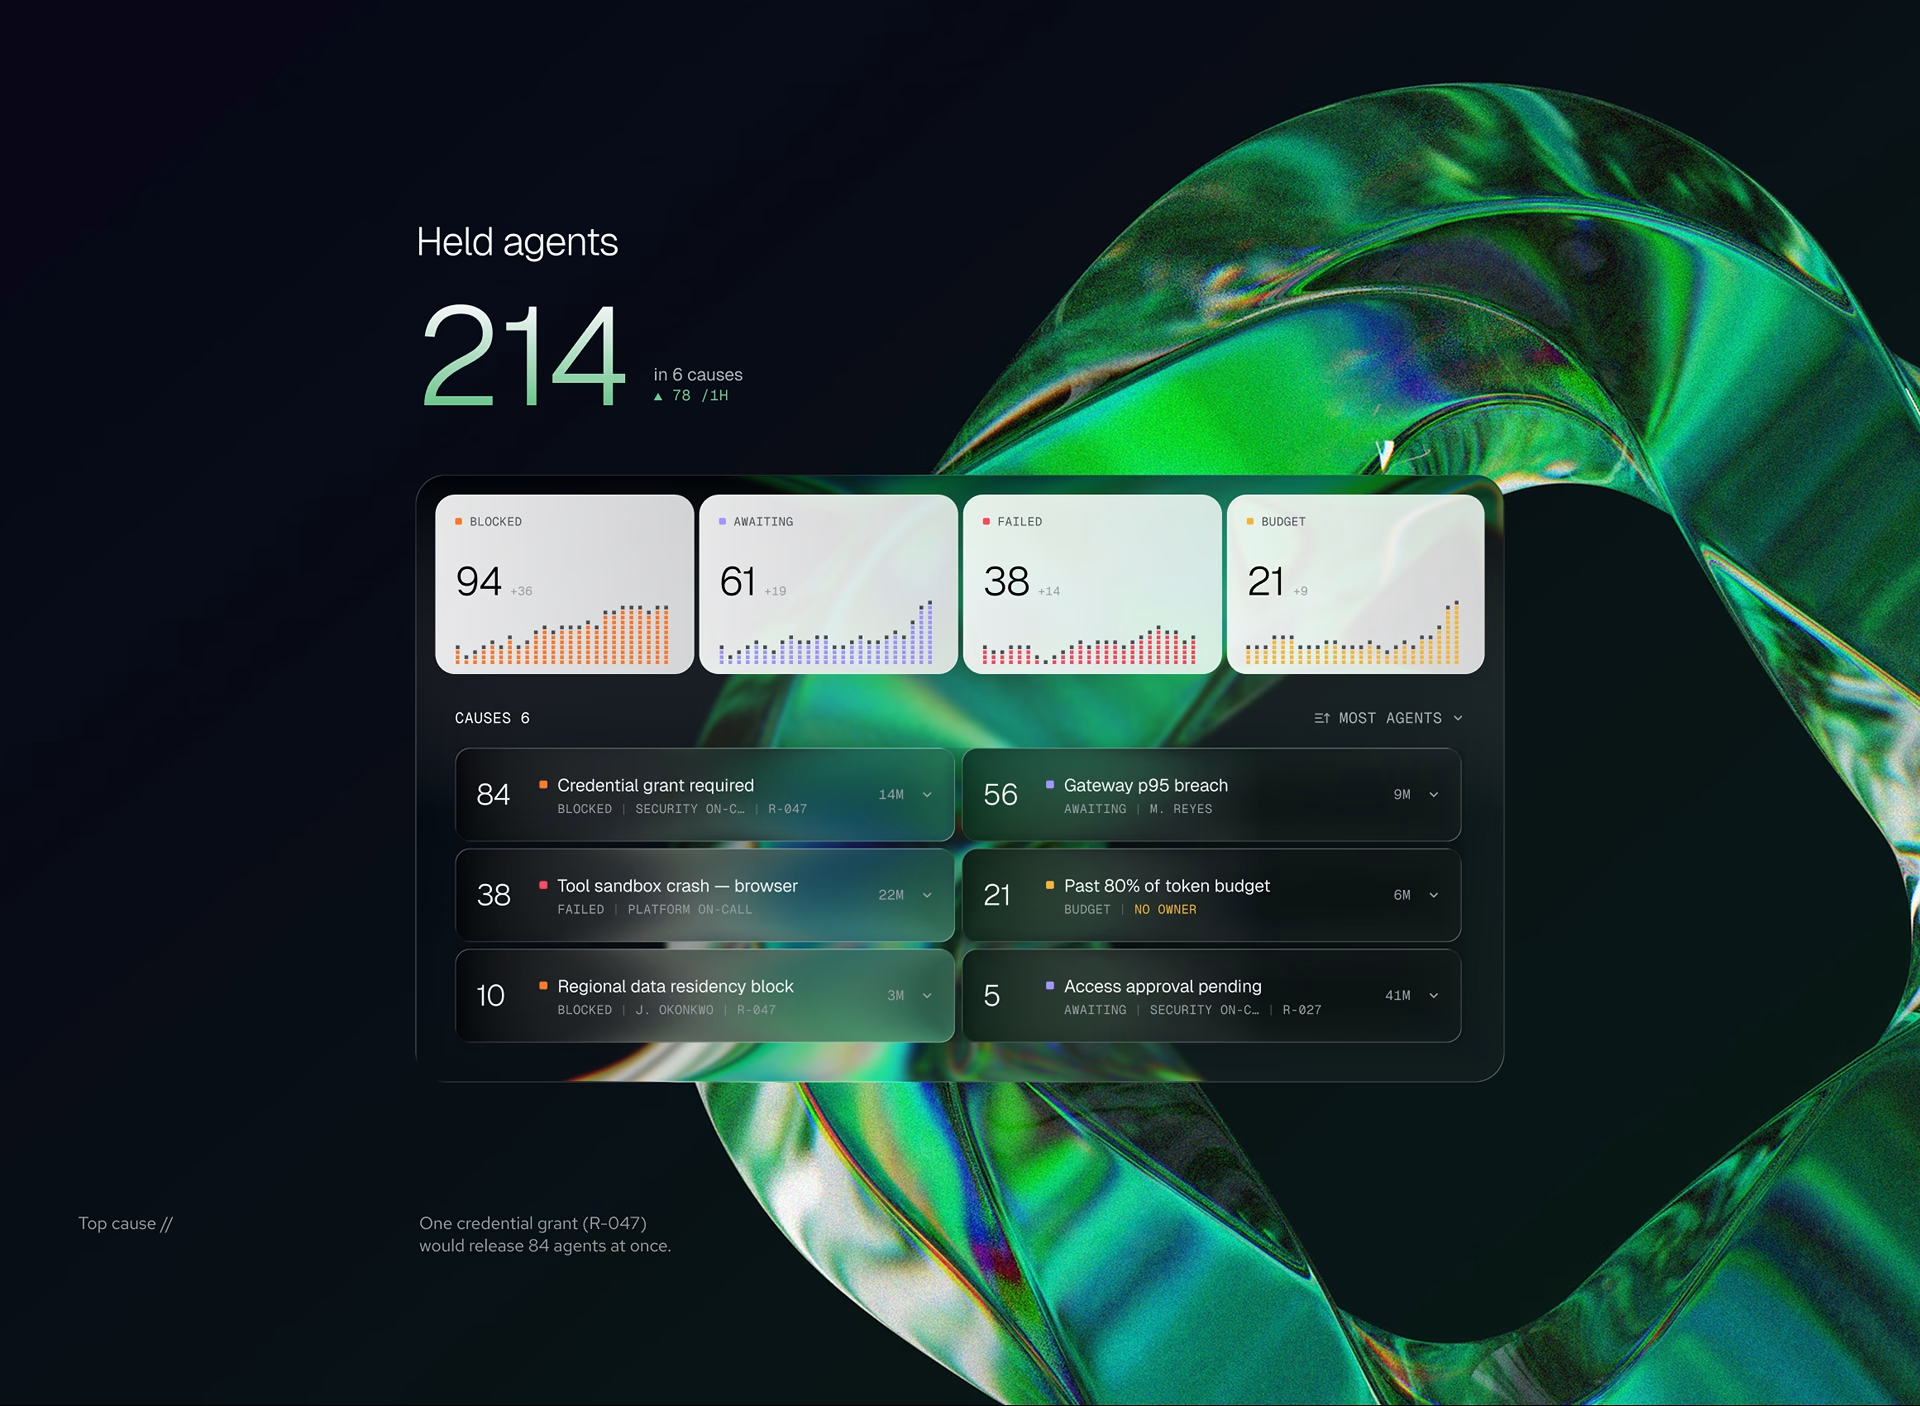
Held agents grouped by shared cause, each cause with an owner and a rule, so one fix can release dozens of agents at once.

Goal Deep Dives

Any goal opens to show the resources it depends on, the agents working with each one, and every call it made in the last 24 hours.

Explainable Rules

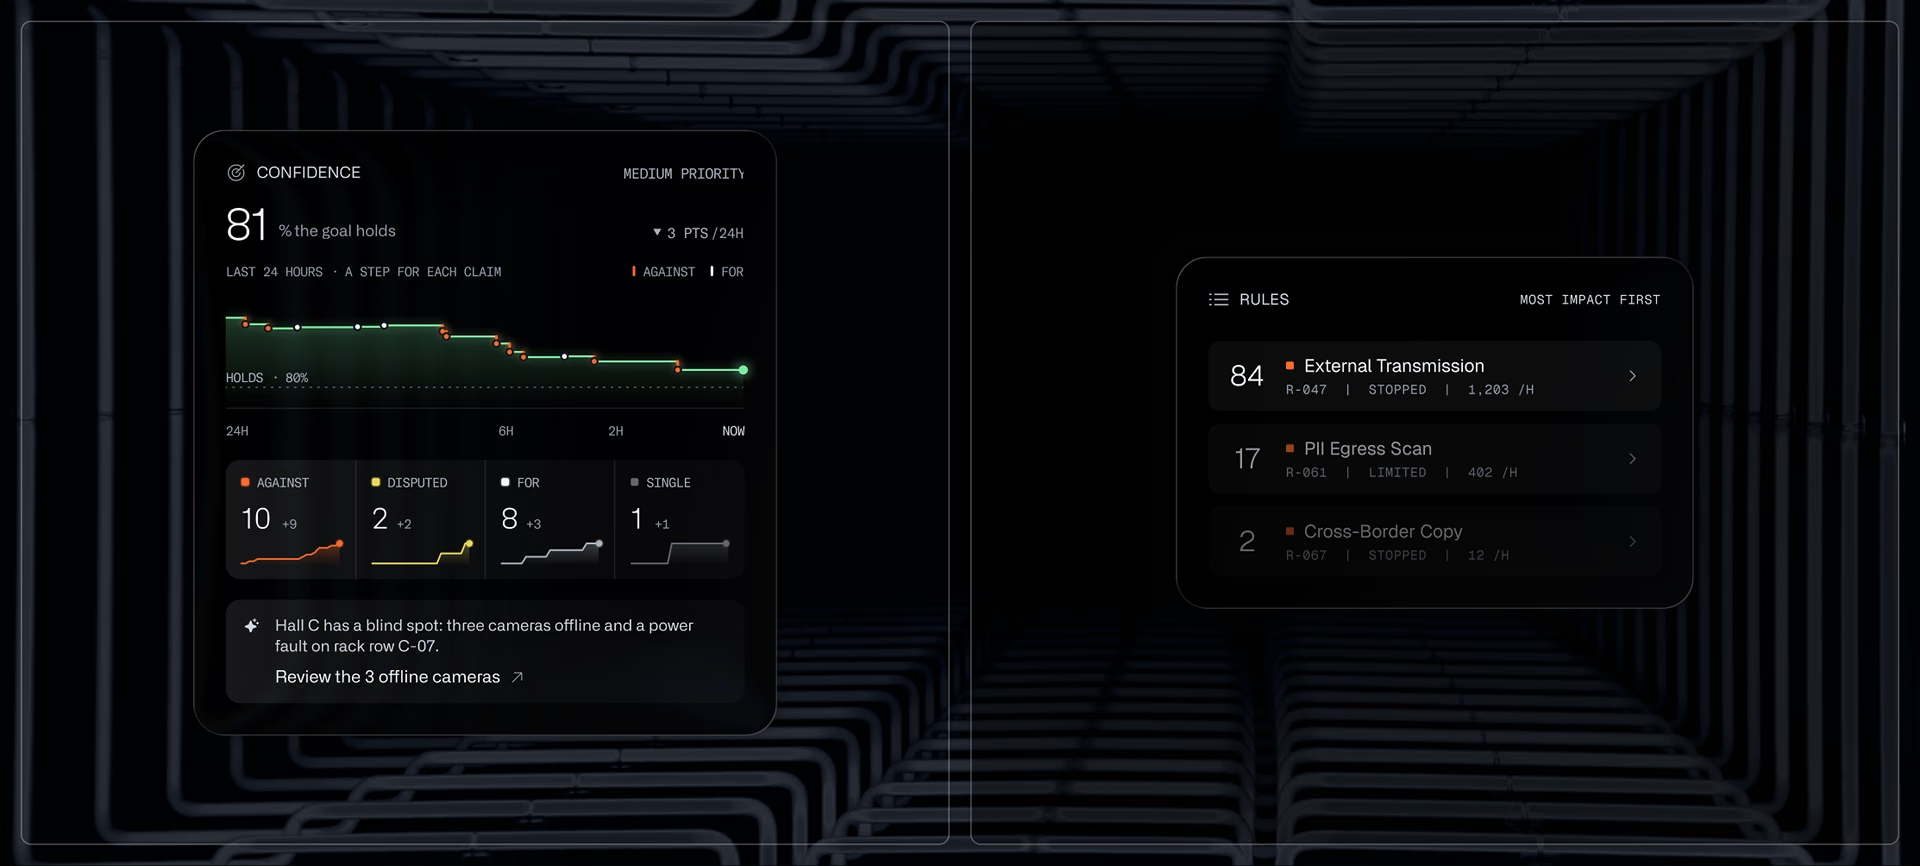
Every blocked action explains itself: what the agent tried, which rule stopped it, the risk involved, and the fix that clears it.

Evidence and Command Dock

Claims build up against each goal as evidence, and one command line lets operators ask, find, and act, with a typed confirmation before any change.

Scope \ The insight

214 agents are held right now. Most share just a handful of causes.

Instead of 214 separate alerts, operators see six causes, each with an owner, the rule behind it, and the agents it holds, ranked by impact.

Scope \ The fleet map

Mission control for your AI workforce

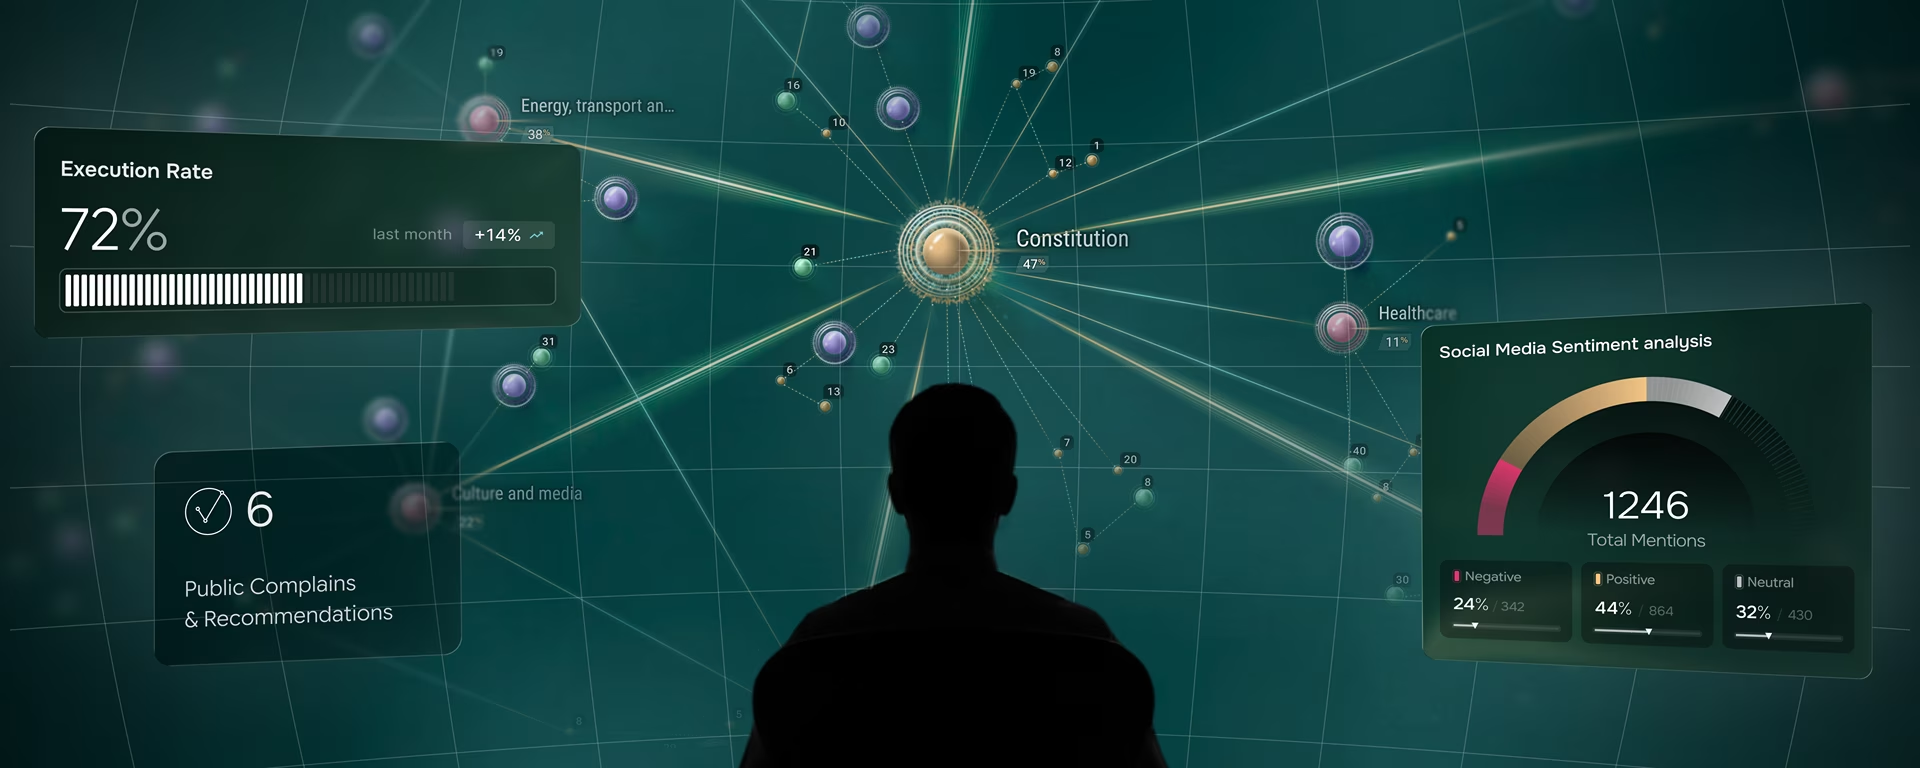
The console opens on a live 3D map: every goal is a cloud of its agents, linked to the apps, databases, devices, models, people, and tools it relies on. The vitals band shows the health of the whole fleet at a glance, and Needs attention groups every held agent by its cause.

Are the goals on track?

Progress, spend, and health for every goal, at a glance on its cloud.

What is going wrong?

Every blocked, failed, waiting, or over-budget agent, plus the connection that stopped it.

What caused it?

The rule, evidence, or site behind each issue, plus the next step to take.

Scope \ Five views

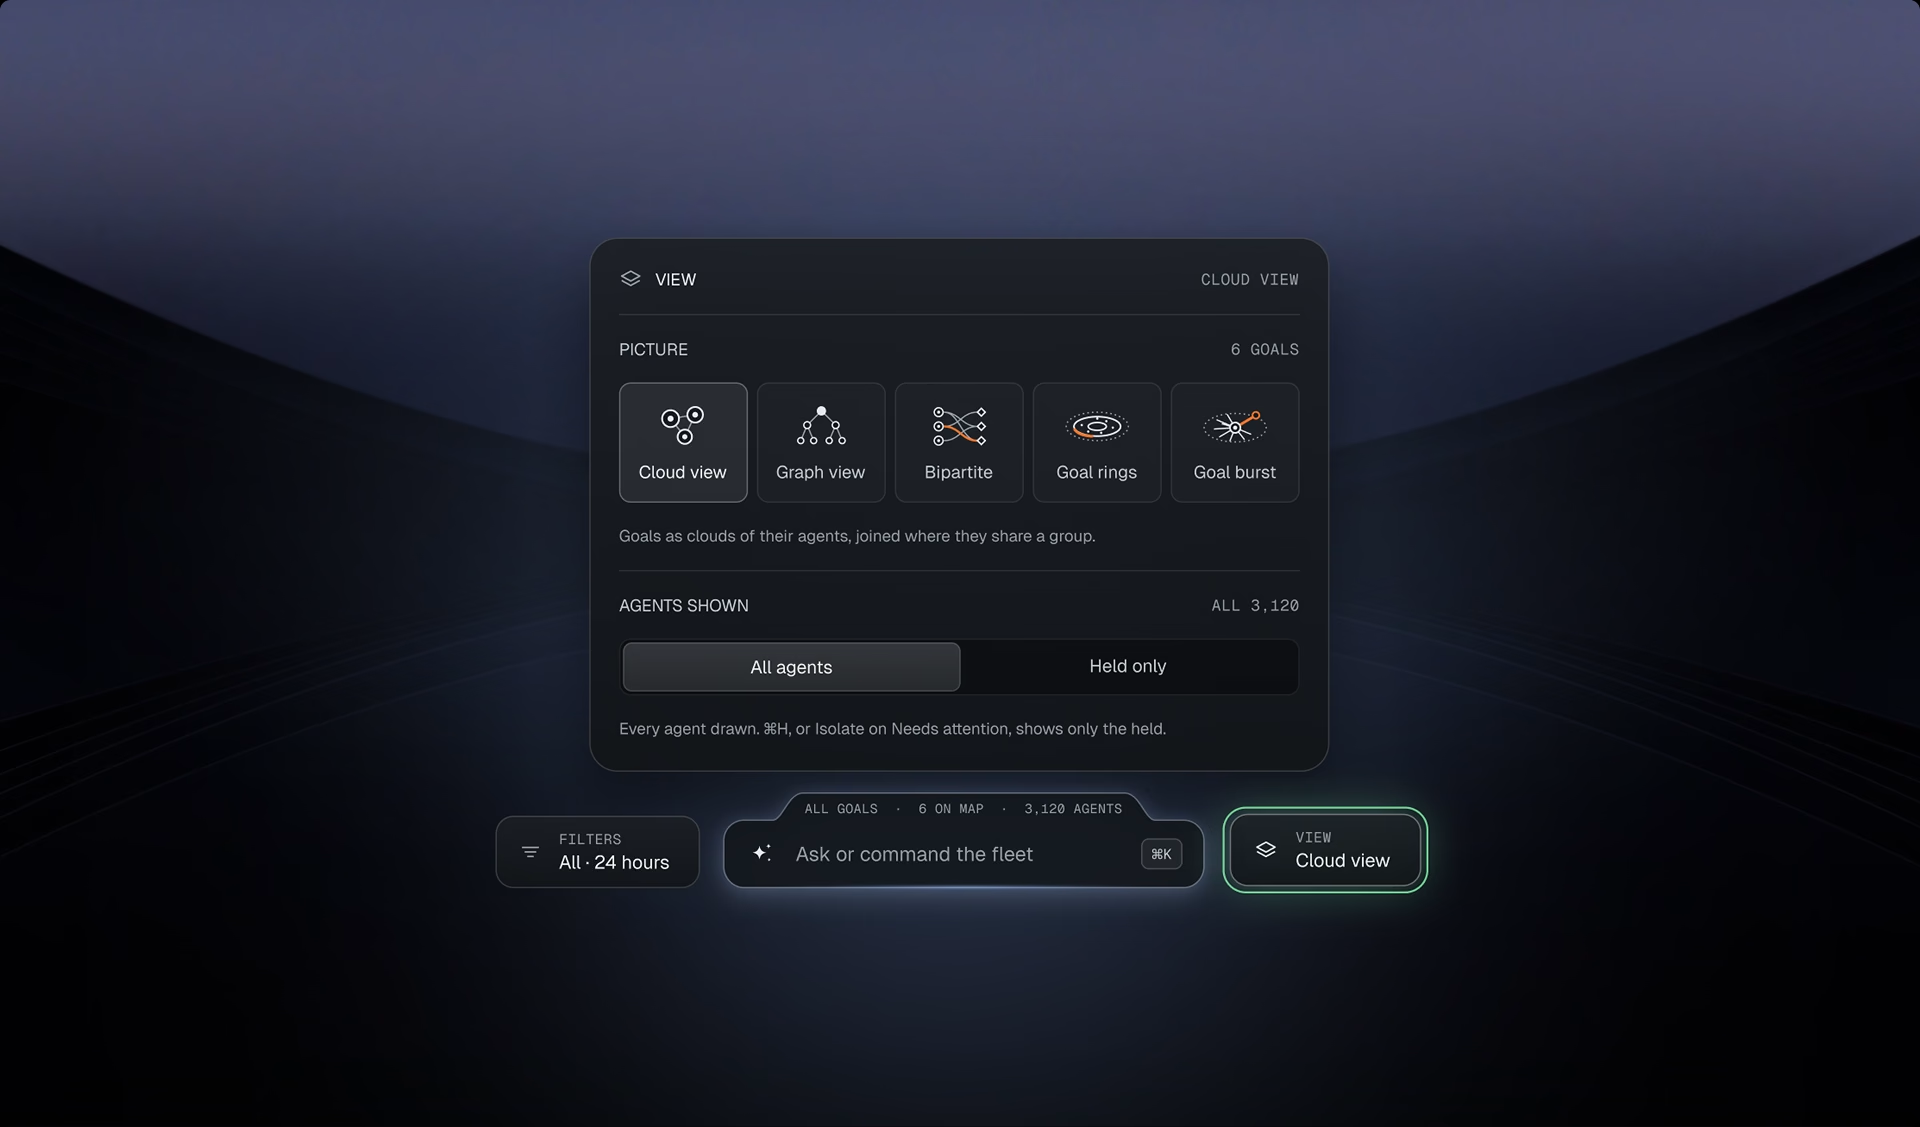
Five views of one fleet, one click apart

Cloud, Graph, Bipartite, Rings, and Burst each answer a different question.

Cloud and Graph show the whole fleet; Bipartite lines goals up against the resources they draw on.

Rings and Burst open a single goal, from where its agents sit to how fast every call they make comes back.

Scope \ Inside a goal

Open a goal to see what drives it

One click on a cloud opens its goal view.

Goal rings groups agents by the resource they work with and wraps the last 24 hours around the edge.

Goal burst draws every call as a spike, so slow responses stand out, and the vitals band switches to that goal.

Scope \ Root causes

One blocked credential, 84 held agents

The Held only view (⌘H) fades every healthy agent, leaving only the held ones and the services they wait on.

A red line marks a broken connection, where a rule or failure is stopping traffic. Hovering shows why, and a click jumps straight to the cause.

Scope \ Policy engine

Rules that explain every block

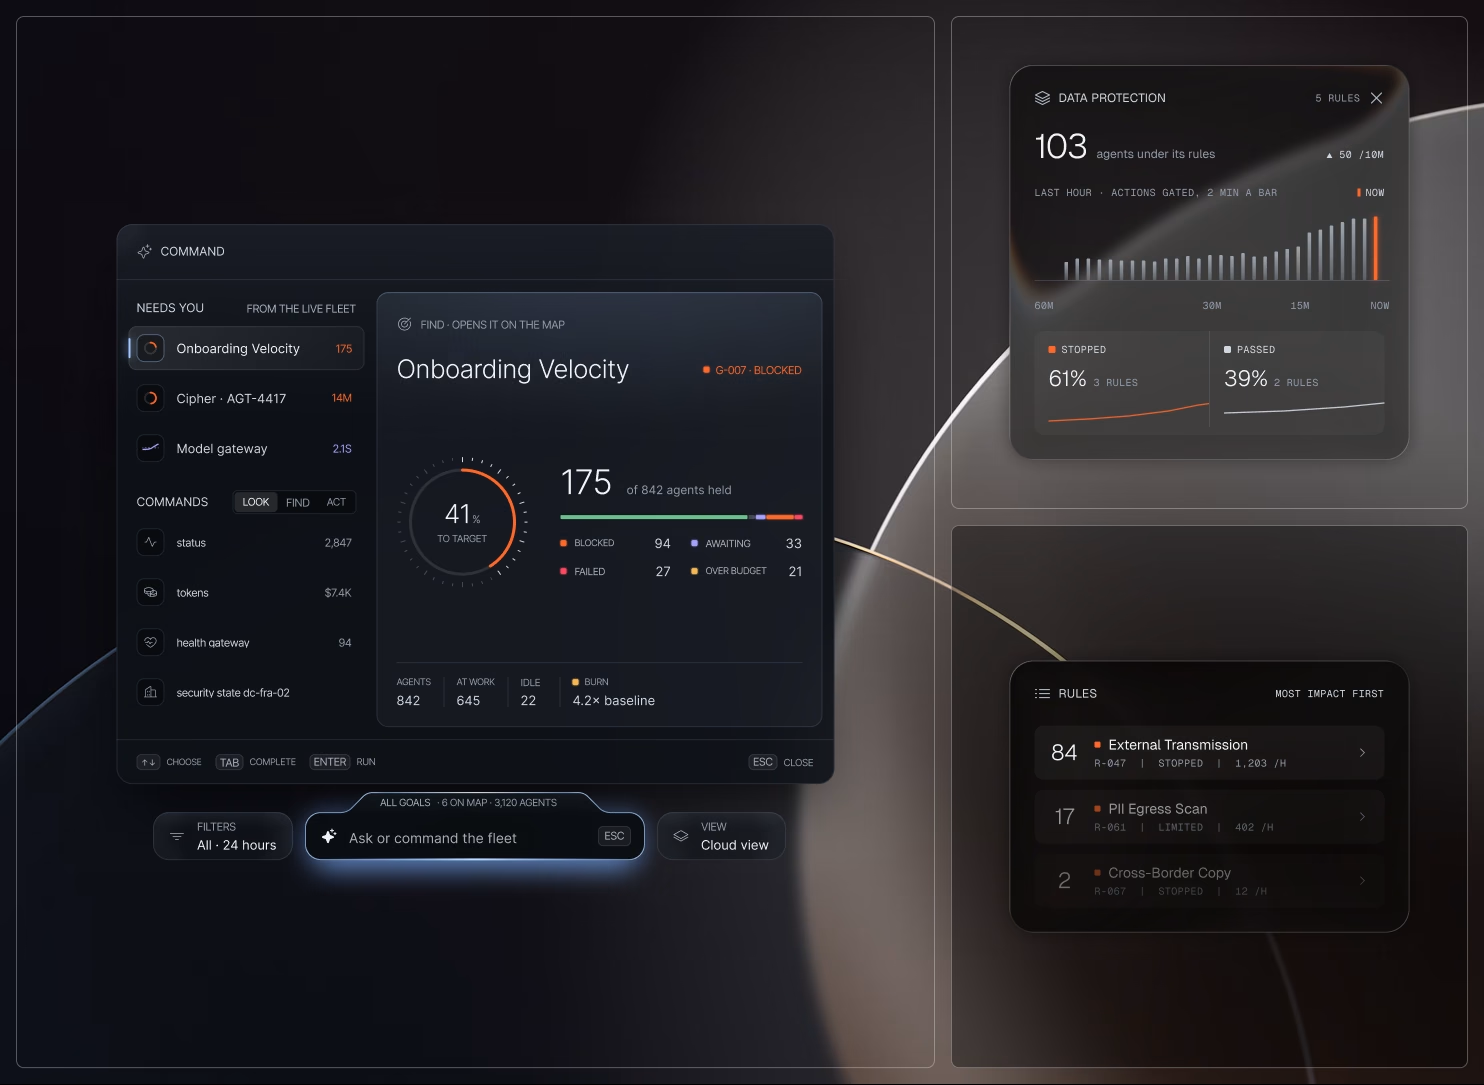
Every action an agent takes runs through the policy engine, rule by rule, and comes out Stopped, Held, or Passed, so nothing risky slips through.

Each block shows what the agent tried, which rules were checked, the one that stopped it, the risk, and the fix, as in ACT-99241’s request for an eu-west residency exception.

Scope \ Evidence view

Decide on evidence, then act

Each goal gets an evidence column, with the newest claims at the top and eight hours per ring.

Claims land on the ring of the hour they arrived in: white supports, orange contradicts, yellow is disputed, and gray rests on one source. Contradictions stay pinned, never averaged away.

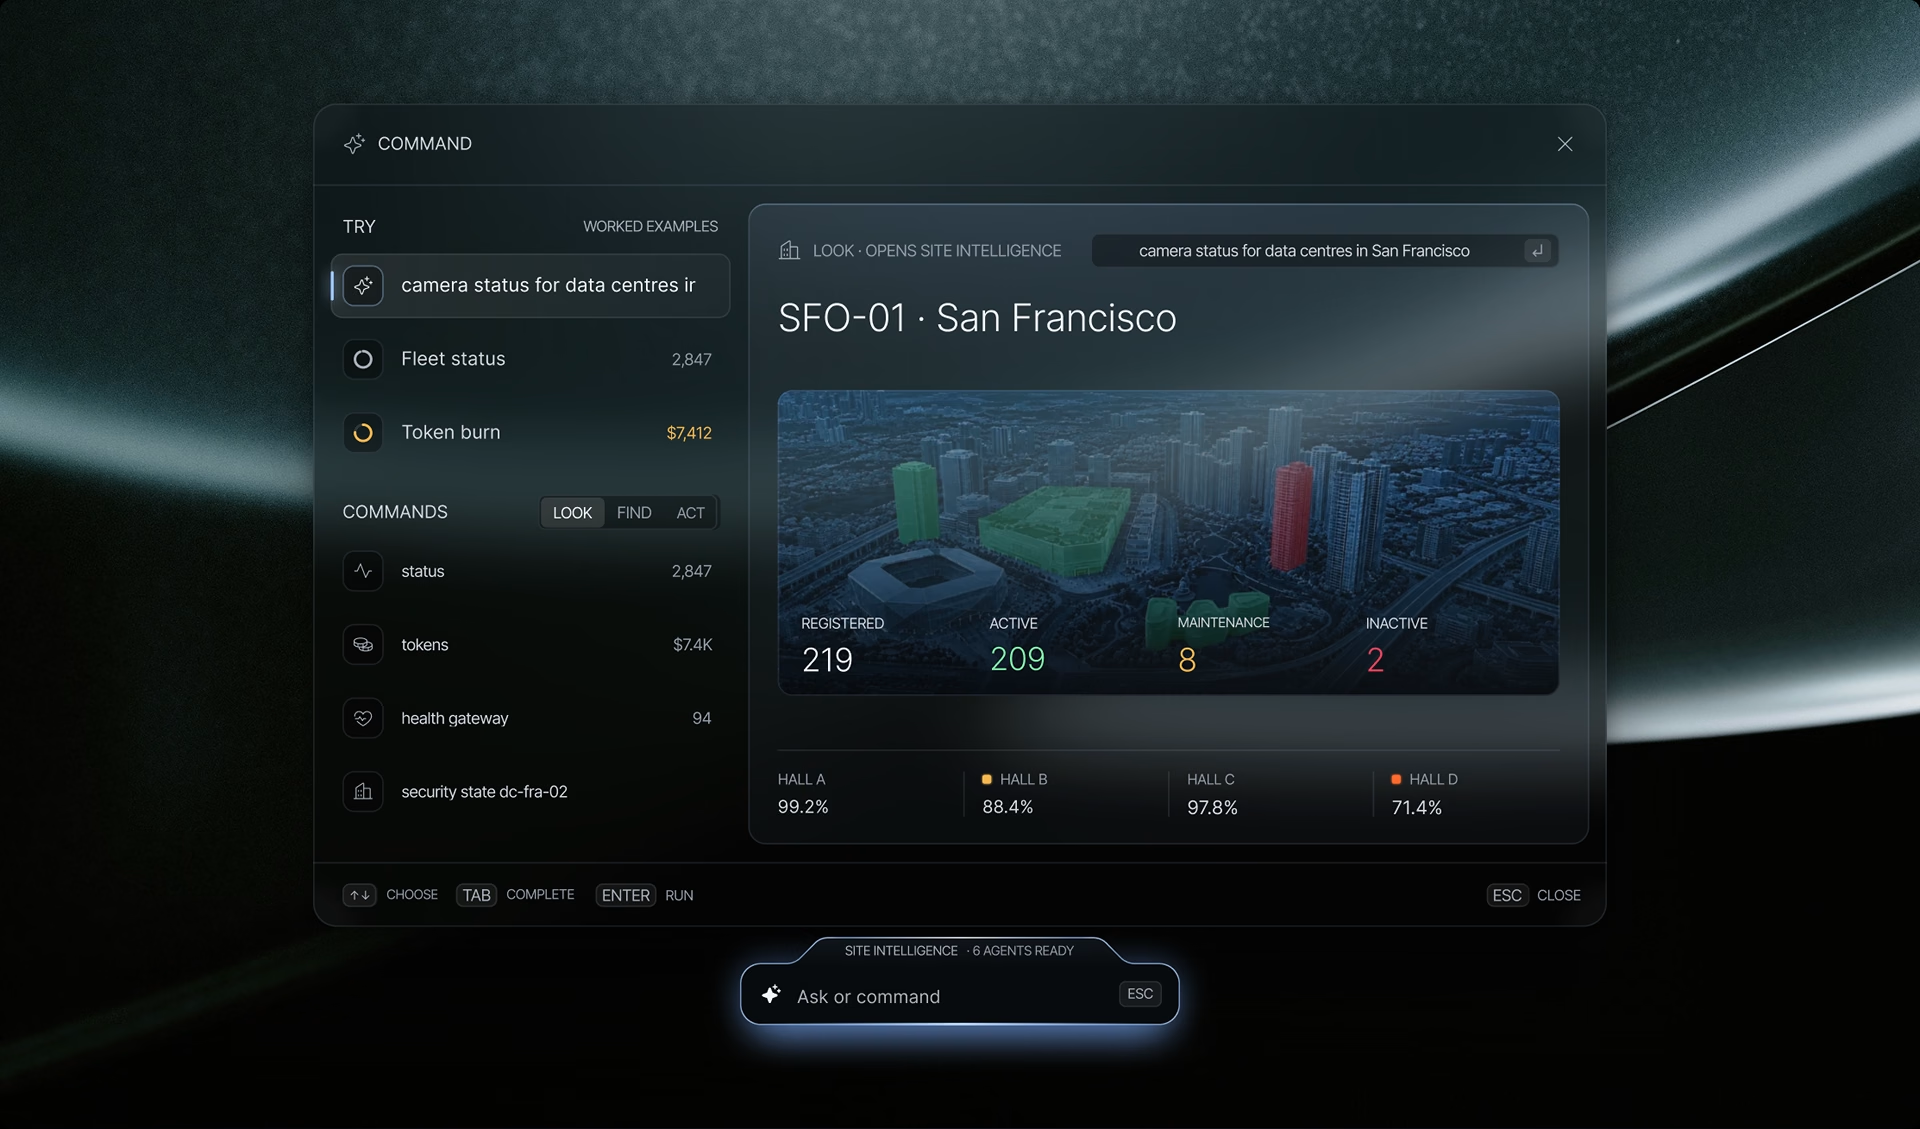
From the same view, ⌘K opens the command line to ask or act. Look, Find, and Act commands run on live data, and anything that touches the fleet needs a typed confirmation, such as PAUSE 48.

Scope \ Site insights

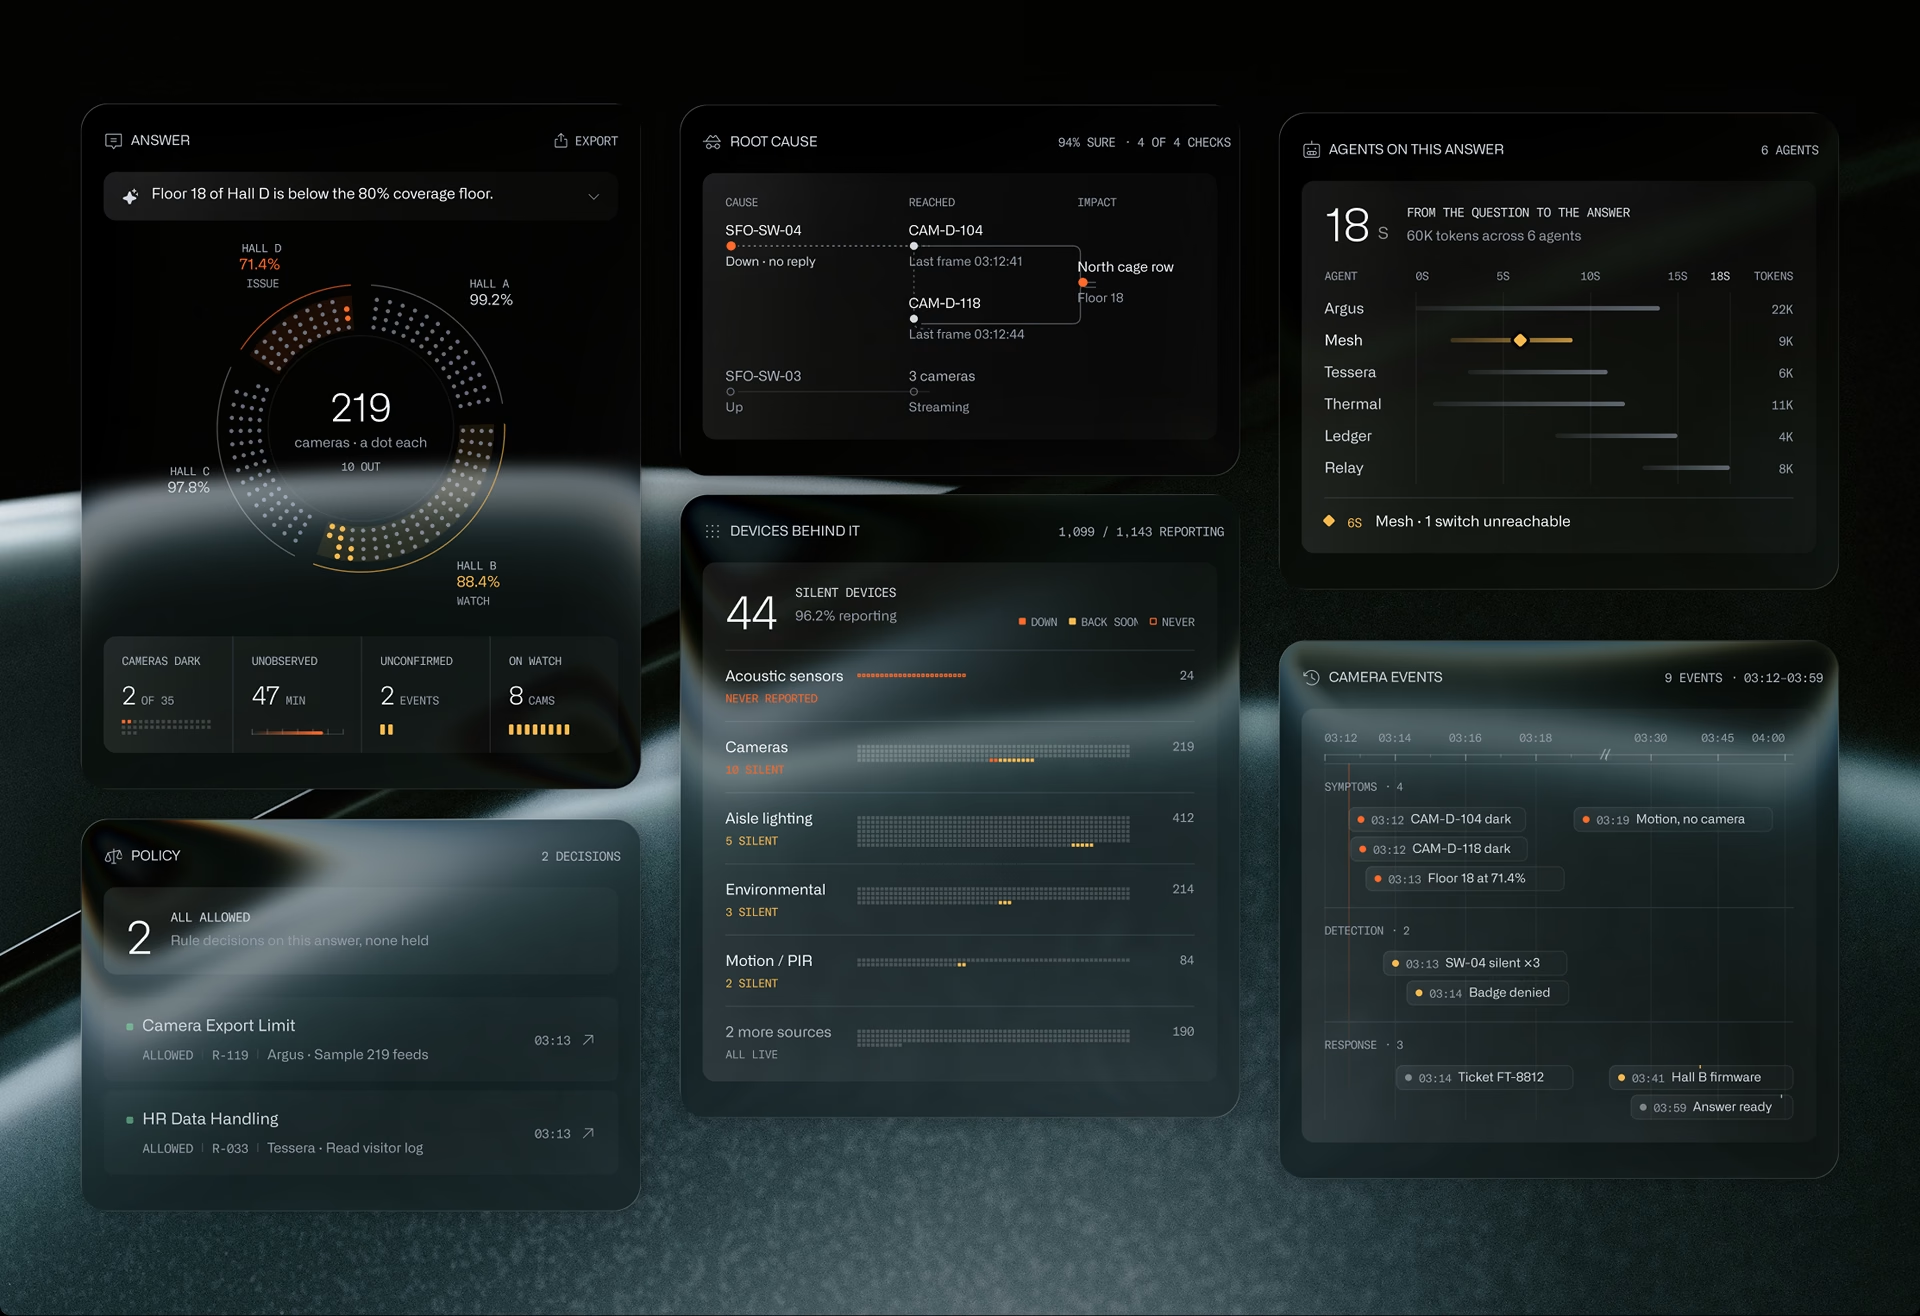
Ask a question, get a site view

Site intelligence starts with a question, not a fixed dashboard.

A request for camera status at San Francisco data centers builds the page in seconds. Operators then drill down in three steps: a city map tinted by health, the tower with the affected floor marked, and the floor plan with its cameras, switches, and events.

Scope \ Control room

A live floor for every team

Zooming into one site, such as Hall D in DC-FRA-02, shows agents working it live: who is where, what they are fixing, and what is waiting for an operator.

Every robot on the floor is an agent at work: Data Core ingesting, Investigation triaging, and a repair already on its way to M-01. A click on any of them shows its task, its spend, and what it is waiting on.

35

Agents on the floor

Every agent on the floor shown at its station, with the task in hand, the team
it belongs to, and how long it has been working.

26

Working right now

Agents busy on live work right now, each showing its progress, the tools it
calls, and the spend it has used so far today.

3

Held for approval

Agents paused at a checkpoint until a person signs off, each with its request
and the risk, ready to approve or decline.

5

Team zones, one command dock

Each team works in its own zone, and one command dock lets operators move
between zones, ask questions, and act in context.

Process

Six phases turned scattered run logs into one operations console for the entire fleet.

Experience Enhancement

One console takes operators from a fleet-wide alert to the exact cause and its fix in seconds.

Fleet Vitals Band

Fleet, spend, insights, and
platform health, live at the top
of every view.

Cause Cards

Each cause card lists its owner,
rule, held agents, and the fix.

Policy Trace

Every block traced rule by
rule, with the risk it carries
and the action that clears it.

Three principles behind every project we design
<span class="highlighted"><small>Users don't come first</small></span><br>Business Comes

Users don't come first
Business Comes

That doesn’t mean ignoring users. Every business benefits from understanding its users and improving the product for them. Being user-centered is valuable because it drives business success.
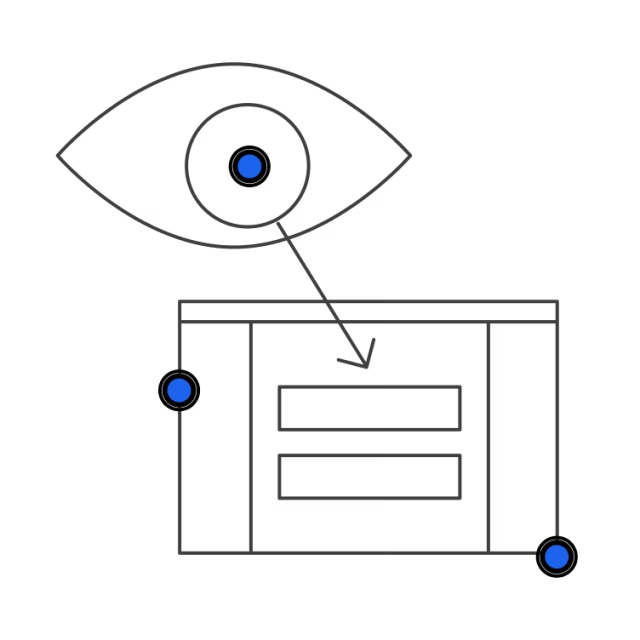
<span class="highlighted"><small>Structure is key</small></span><br>But Good UI Matters

Structure is key
But Good UI Matters

Understanding the relationship between function and design is the art of great UI/UX. Finding the sweet spot is what we do best.
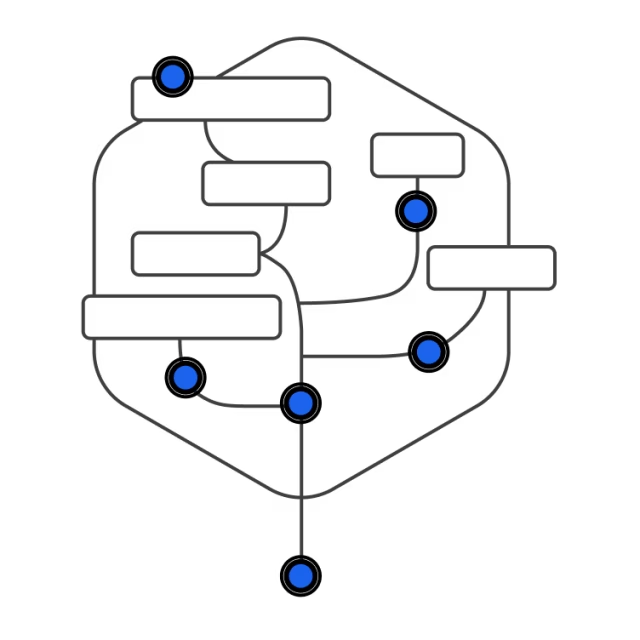
<span class="highlighted"><small>Design is a process</small></span><br>Not An Event

Design is a process
Not An Event

There’s no place for overnight success. We work in short iterations, moving to the result bit by bit, and expect your consistent feedback.

Ready to work with us?

Contact Us

Featured projects

More AI, data visualization, and mission-control work for complex, high-stakes products.