OptivionAi

Services:

AI & ML, Technology

Description:

A network operations center design for OptivionAI, an AI-assisted telecom operations platform that takes each incident from national overview to component-level diagnosis and field resolution.

Visibility

Visibility Real-time visibility across 
the service area

OptivionAI combines geographic context with live 
performance indicators to expose congestion, degraded links, 
and service impact.

Operators can move from a city-level signal anomaly to the affected site without losing the surrounding operational context. City-scale network monitoring fails when every alert weighs the same.

This view sorts the city by exception: the Failure Band Drop markers and a SINR reading of -14 dB pull the eye to Sector C1, while healthy sites recede into the map. Packet loss, SLA breach risk, and latency stay one glance away on the KPI rail.

Introduction

Connected infrastructure, made operational

A unified 3D topology brings every critical network element into one operational view.

Live status, incidents, and dependencies are mapped directly onto the infrastructure so teams can understand how a local fault propagates across the wider system.
An alarm list tells an operator that something failed.

The topology tells them where, and what sits downstream. Every element on site 5G-TX-303 is drawn in place with its live state, from the BBU pool to the fiber distribution hub, so a degraded backhaul link reads as a path through real equipment rather than a row in a queue.
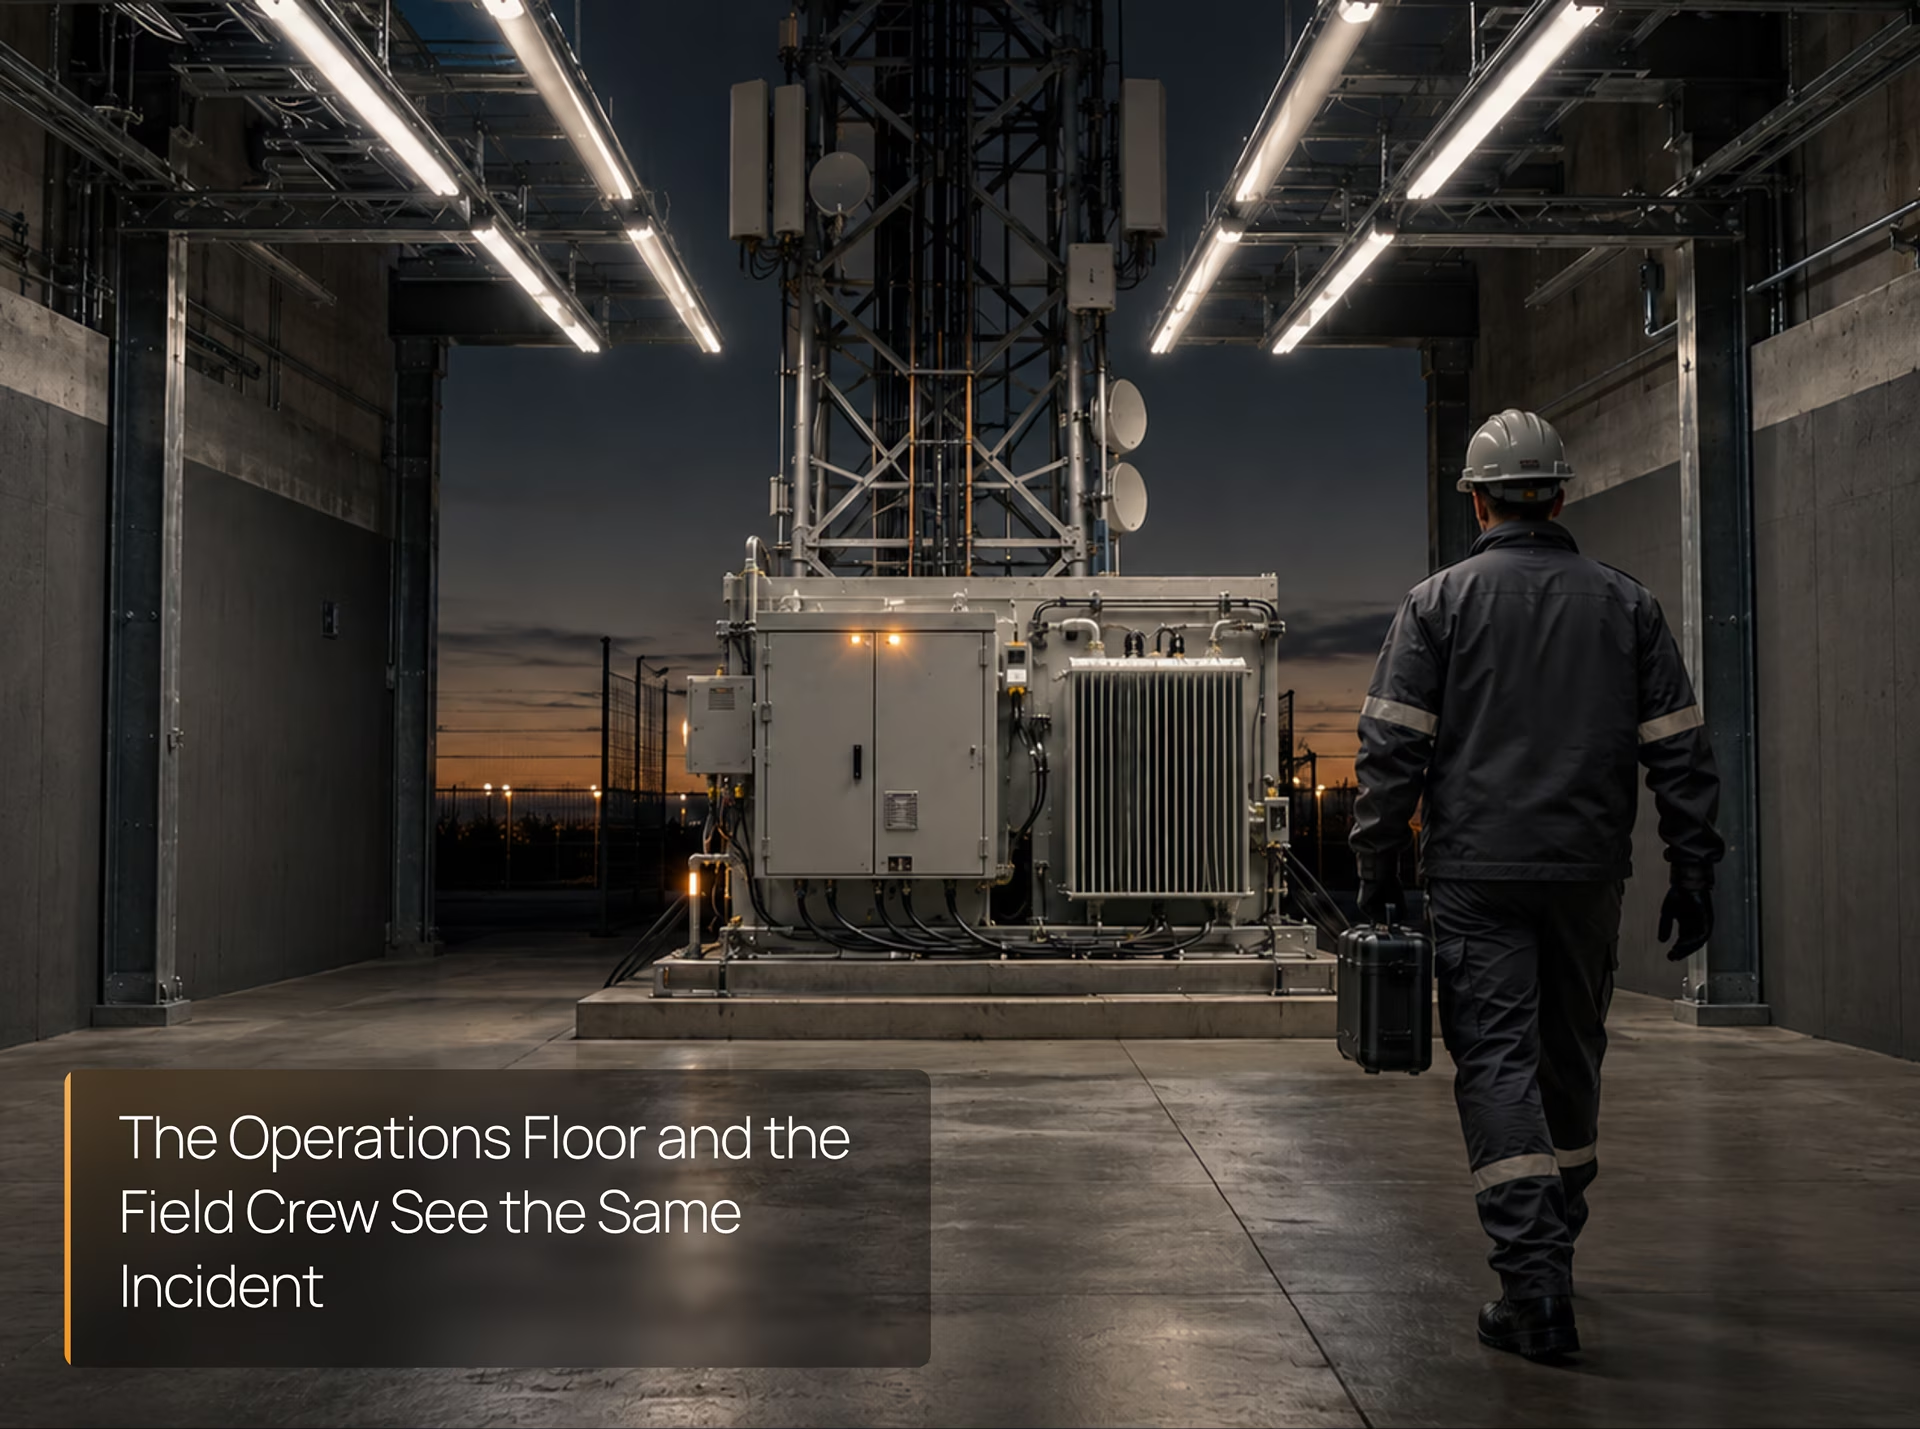
The Operations Floor and the Field Crew See the Same Incident
Operations

A shared operational picture for every team

The platform connects component diagnostics, site conditions, and field activity in one visual language.

Network engineers and technicians can collaborate around the same evidence, reducing handoff friction and accelerating recovery.A power amplifier anomaly reaches the engineer and the field technician the same way: severity, the event trail behind it, and two actions, Fix Steps and Wire Plan.

Whoever opens it, on the roof or at the operations desk, reads one incident record, not two versions of it. That is what makes the handoff disappear.

1

National Command View

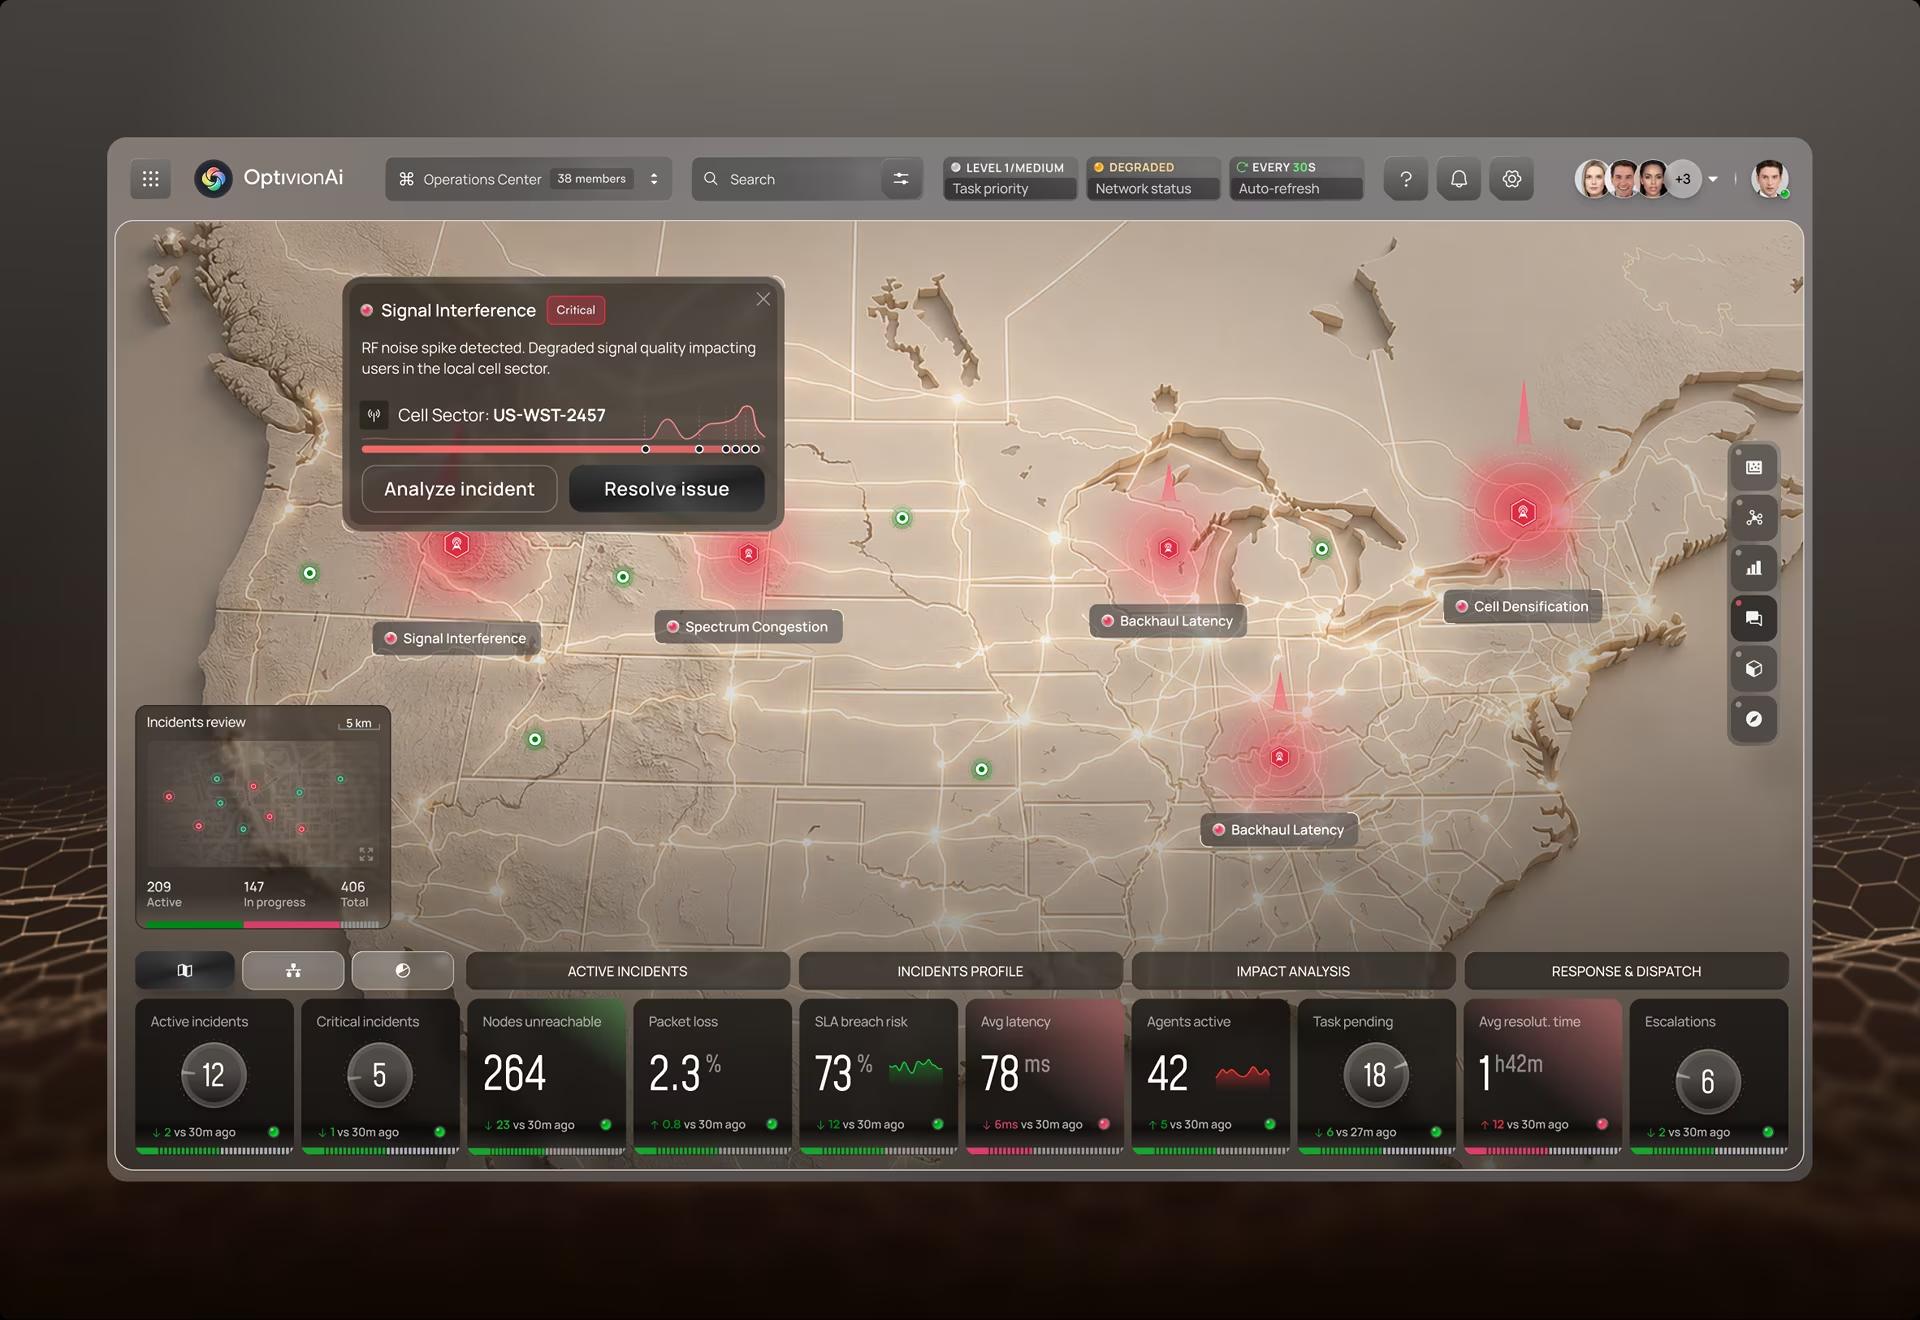
A US-wide map of incident severity, service impact, and response workload, with a direct path into any site

2


Site & Sector Monitoring

Live packet loss, band utilization, and antenna analytics for every cell site, shown here on 5G-TX-303.

3


Component-Level Diagnostics

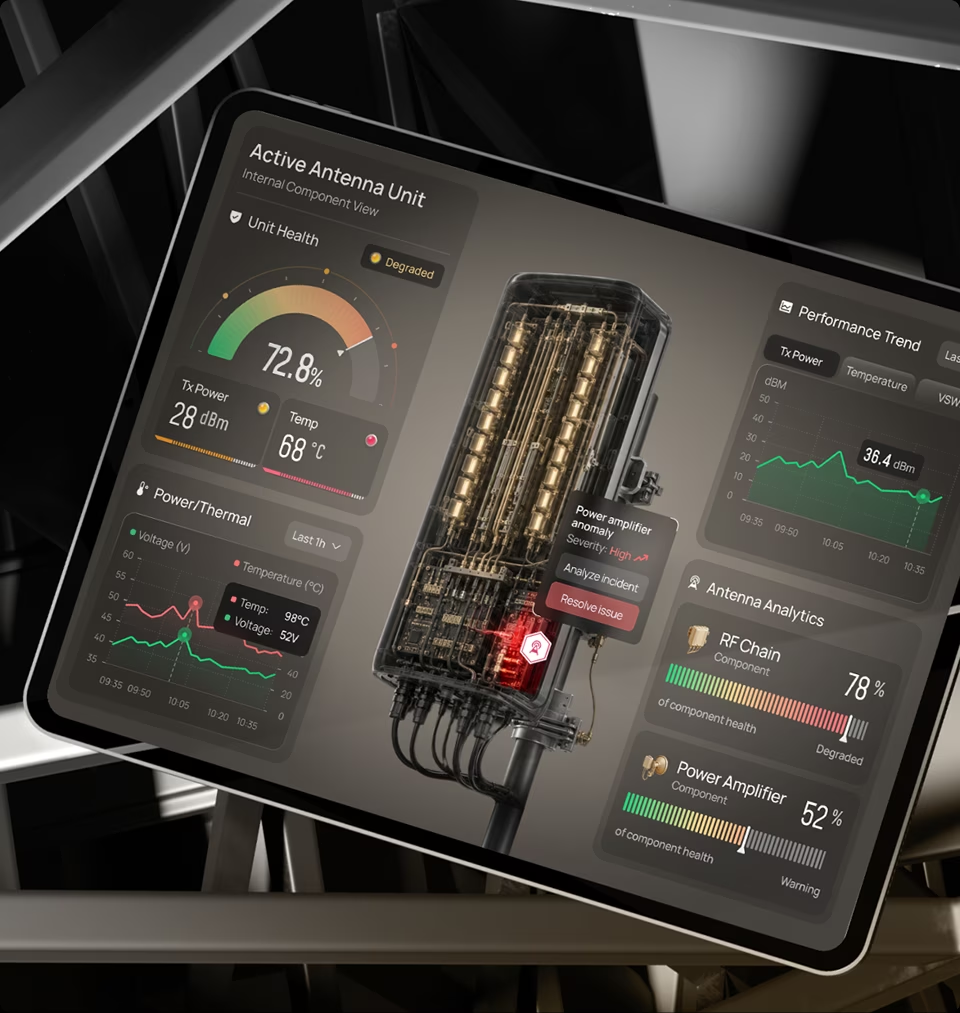
An internal view of each antenna unit, radio module, and controller, with health scored per component.

4


Wire Plan & Power Flow

Circuit-level power and signal routing for a selected sector, with loss traced from cause to output impact.

5


Fix Steps & Field Dispatch

Recommended actions and technician dispatch, issued from the same incident record the alert opened.

A shared operational picture for every team
Wire Plan

Six circuits, one critical fault

Six circuits feed Sector C1, and the wire plan shows exactly one of them, the L2 feed, in a critical state.

An operator can hide everything but the affected path, watch the voltage drop from 48V to 36.3V along it, and see which downstream systems ride on the same line. Fault isolation is a filtering problem, and this screen treats it that way.

Six circuits, one critical fault
Six circuits, one critical fault Six circuits, one critical fault
Power Flow

Tracing power loss from cause to impact

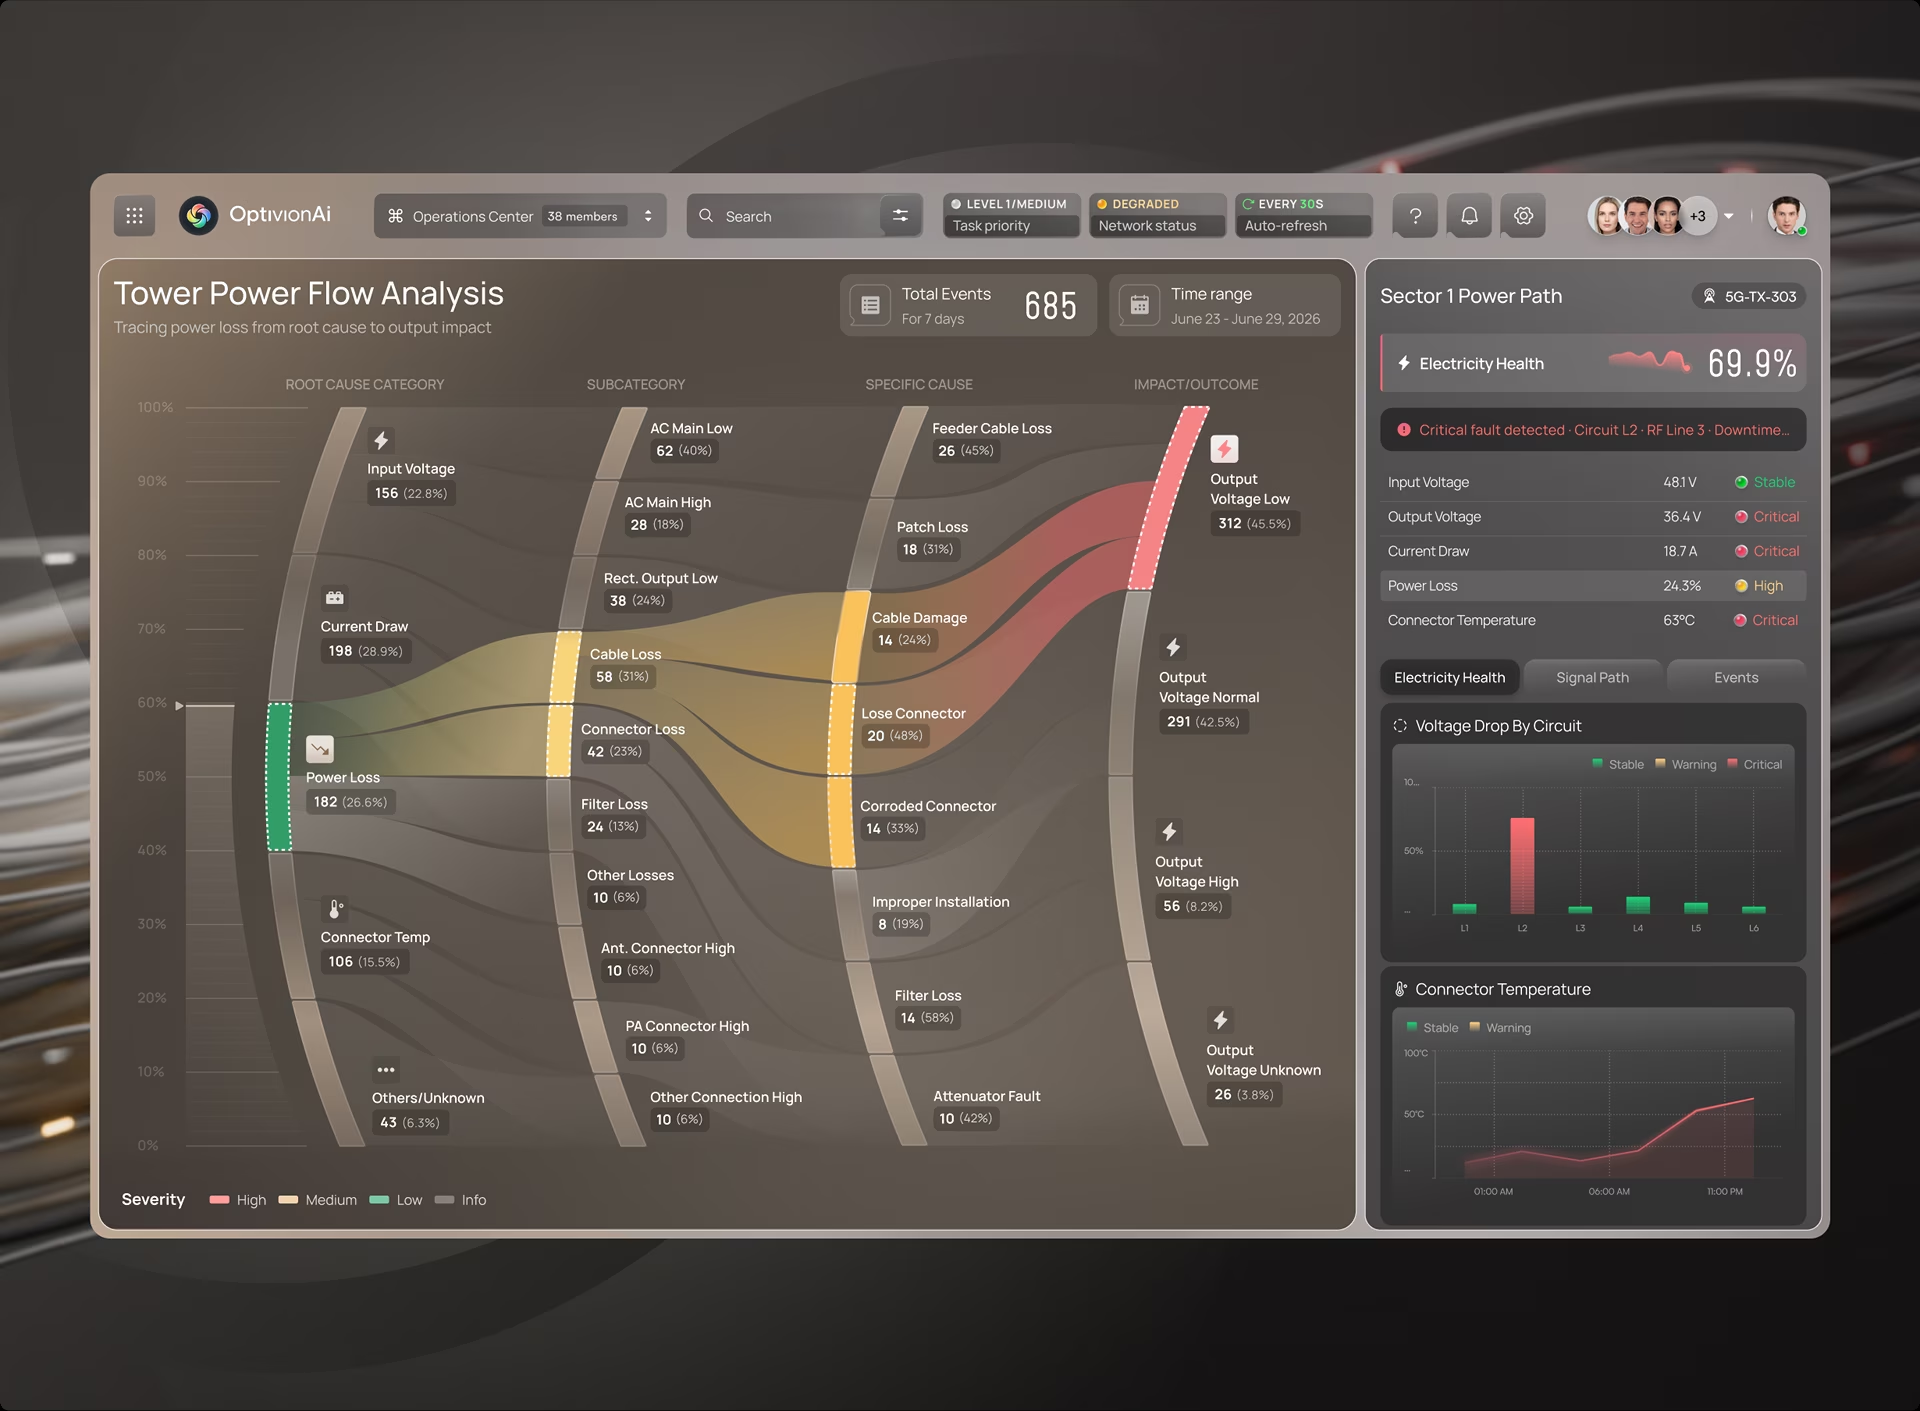
The power-flow analysis reveals how input voltage, current draw, power loss, and connector temperature contribute to downstream failures.

Interactive Sankey paths make the dominant root causes visible and connect them directly to affected output-voltage outcomes. Root cause analysis usually means a query, an export, and an argument about what the data meant. The Tower Power Flow Analysis compresses that into one reading.

685 events across seven days flow from cause categories to outcomes, and path width carries the case count.
The eye lands on the highlighted path, a connector problem, before anyone has written a query.
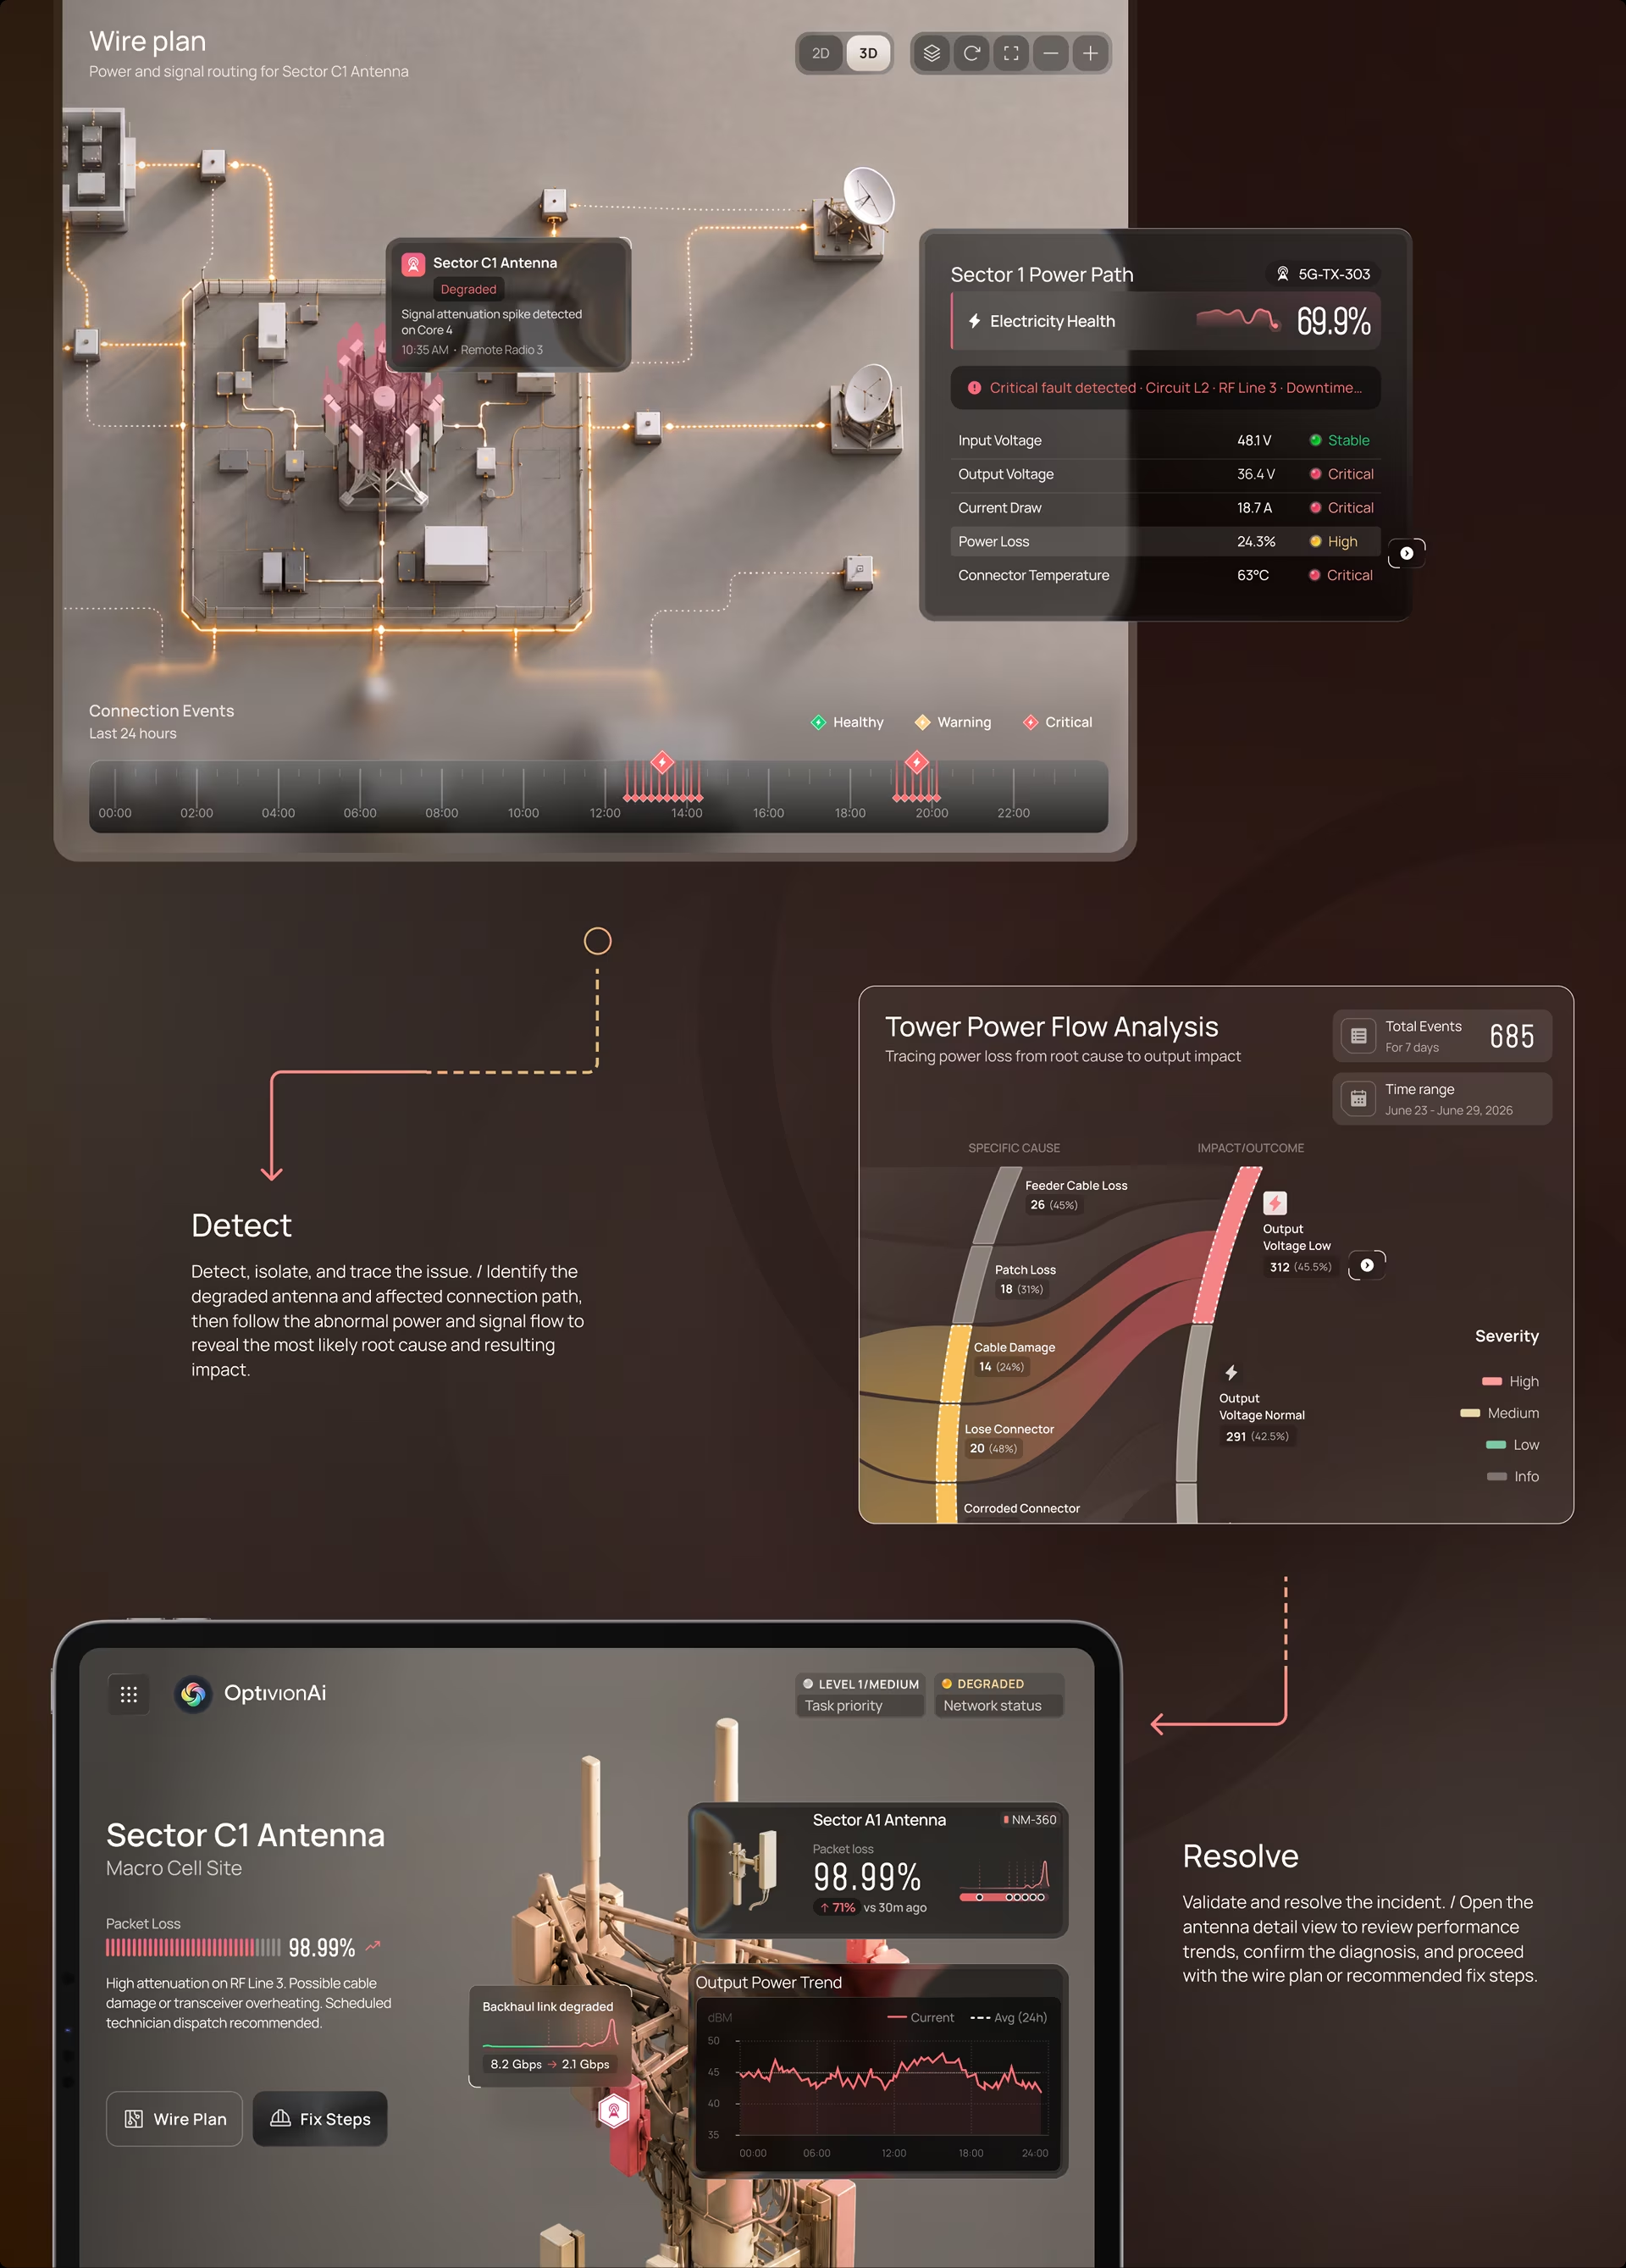
Tracing power loss from cause to impact
Power Flow

Component-level intelligence for complex cell sites

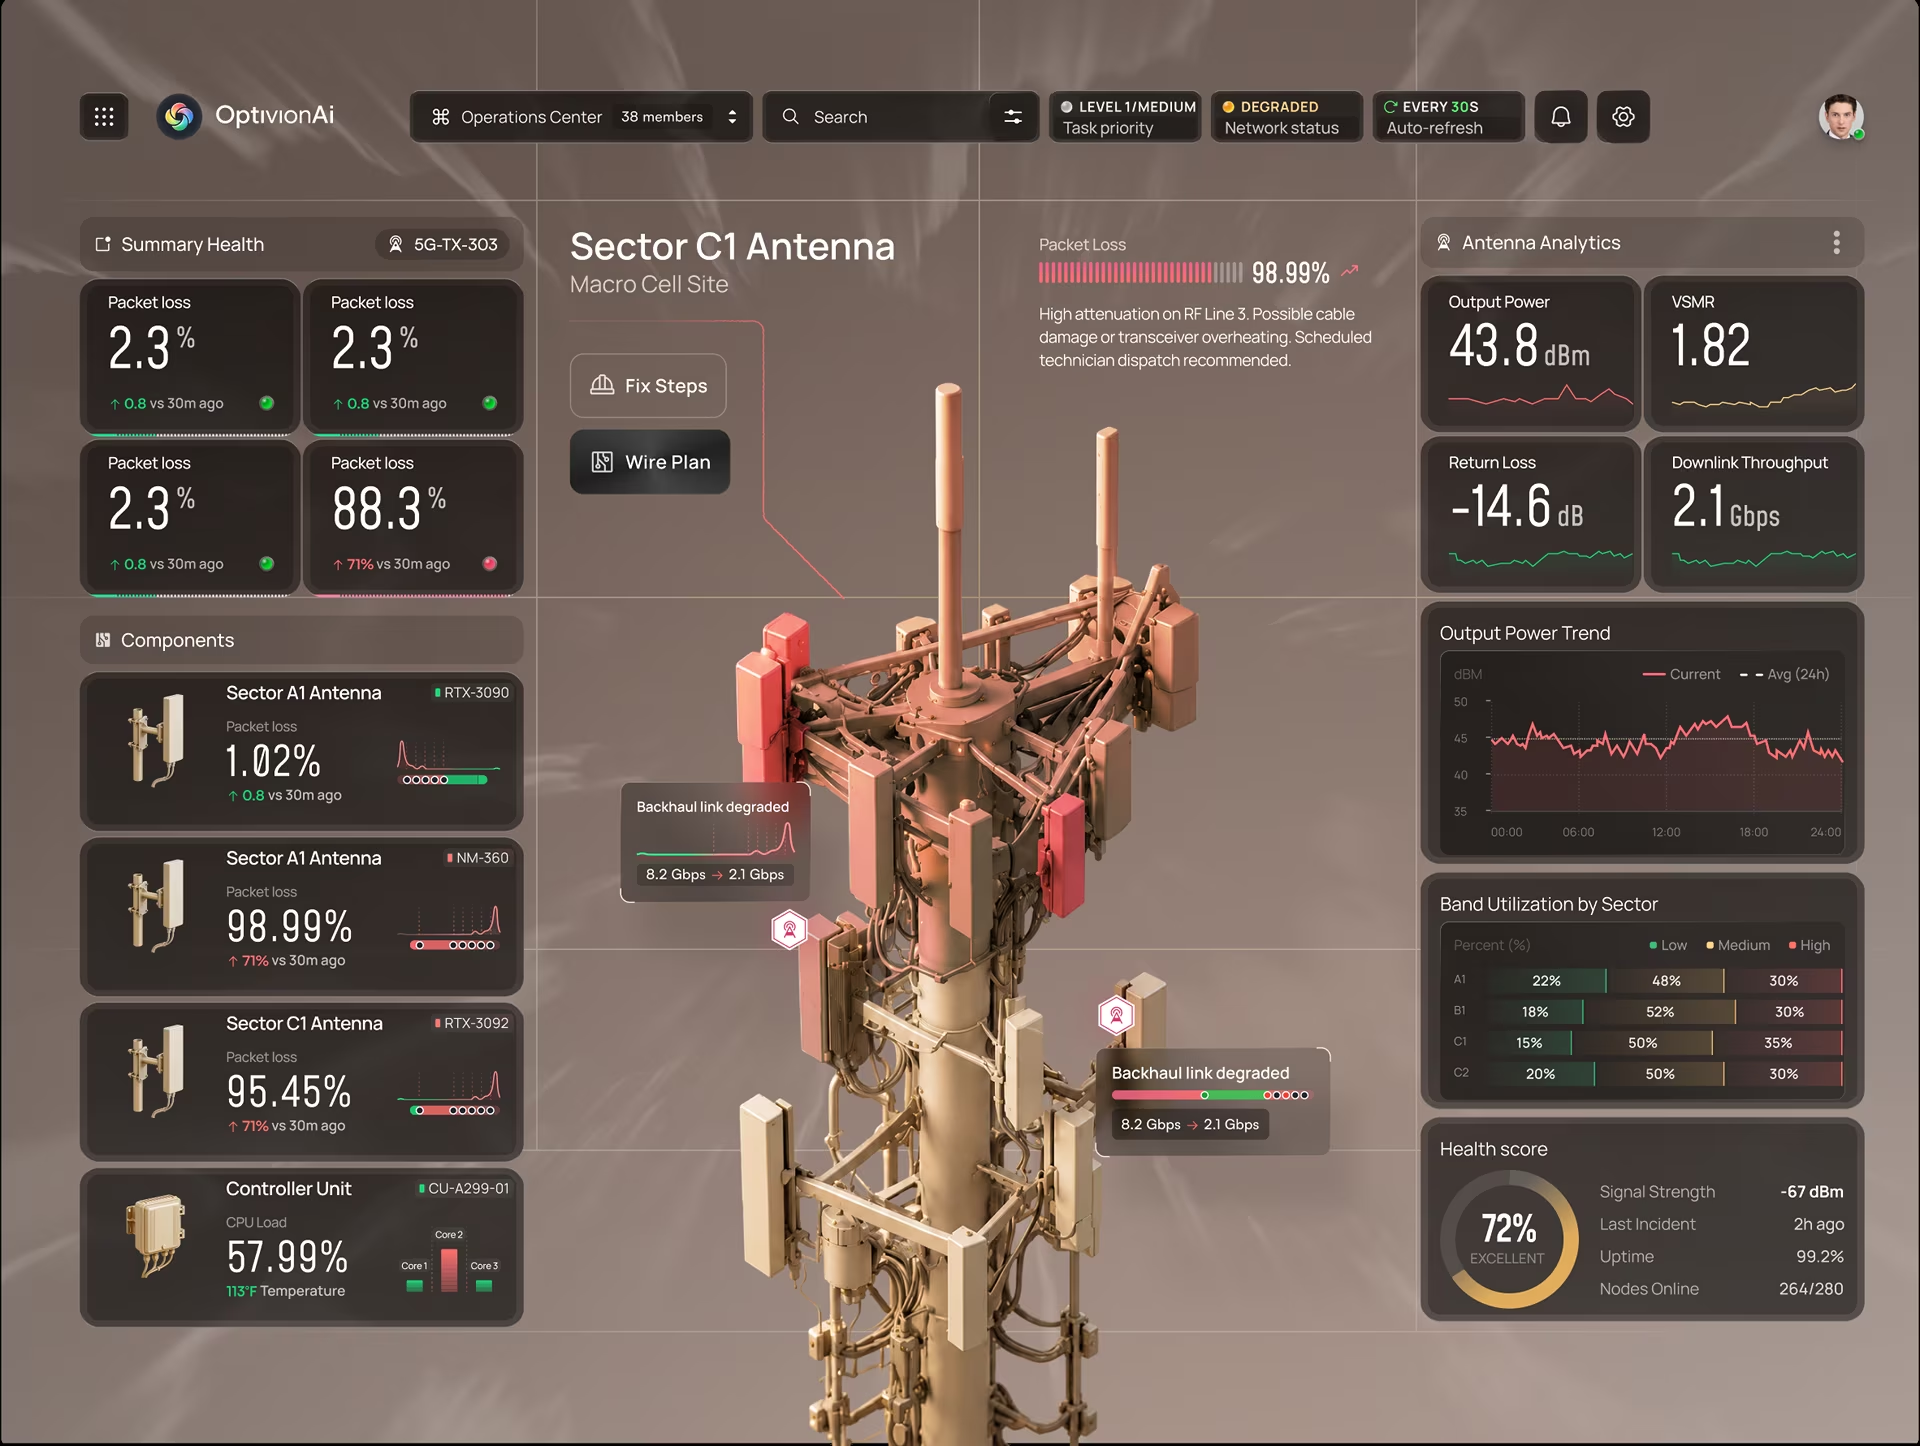
A detailed digital twin exposes the health of antennas, controllers, radio units, and backhaul components.

Operators can compare live telemetry, component condition, and performance trends while keeping the affected hardware in view. Telemetry alone cannot say which part to replace.

The twin view can: the components panel scores each module separately, so the NM-360 radio unit at 98.99% packet loss stands apart from its healthy neighbor on the same mast, every score tied to the hardware it describes. That pairing turns a warning into a decision between a remote fix and a truck roll.

Component-level intelligence for complex cell sites
Network

Network-wide awareness from a single command view

The national overview consolidates incident severity, service impact, response workload, and regional network health.

It gives operations leaders a fast way to prioritize attention while preserving a direct path into site-level detail.
A network operations center rarely buys its tooling once; monitoring, ticketing, and diagnostics usually arrive from different vendors in different decades.

OptivionAI runs all three in one system, as a single record that travels: raised as an alert on the national map, diagnosed down to the failing component, closed by a technician on the roof.

Network-wide awareness from a single 
command view
Network-wide awareness from a single 
command view Network-wide awareness from a single 
command view
Scope

From national map to antenna module

Fuselab designed the OptivionAI platform end to end, covering app development, dashboard design, data visualization, and interface design and UX.

The network operations center design in this case study runs from the national command view down through city and site monitoring to component internals and circuit-level power flow. Every render on this page is the design work itself.
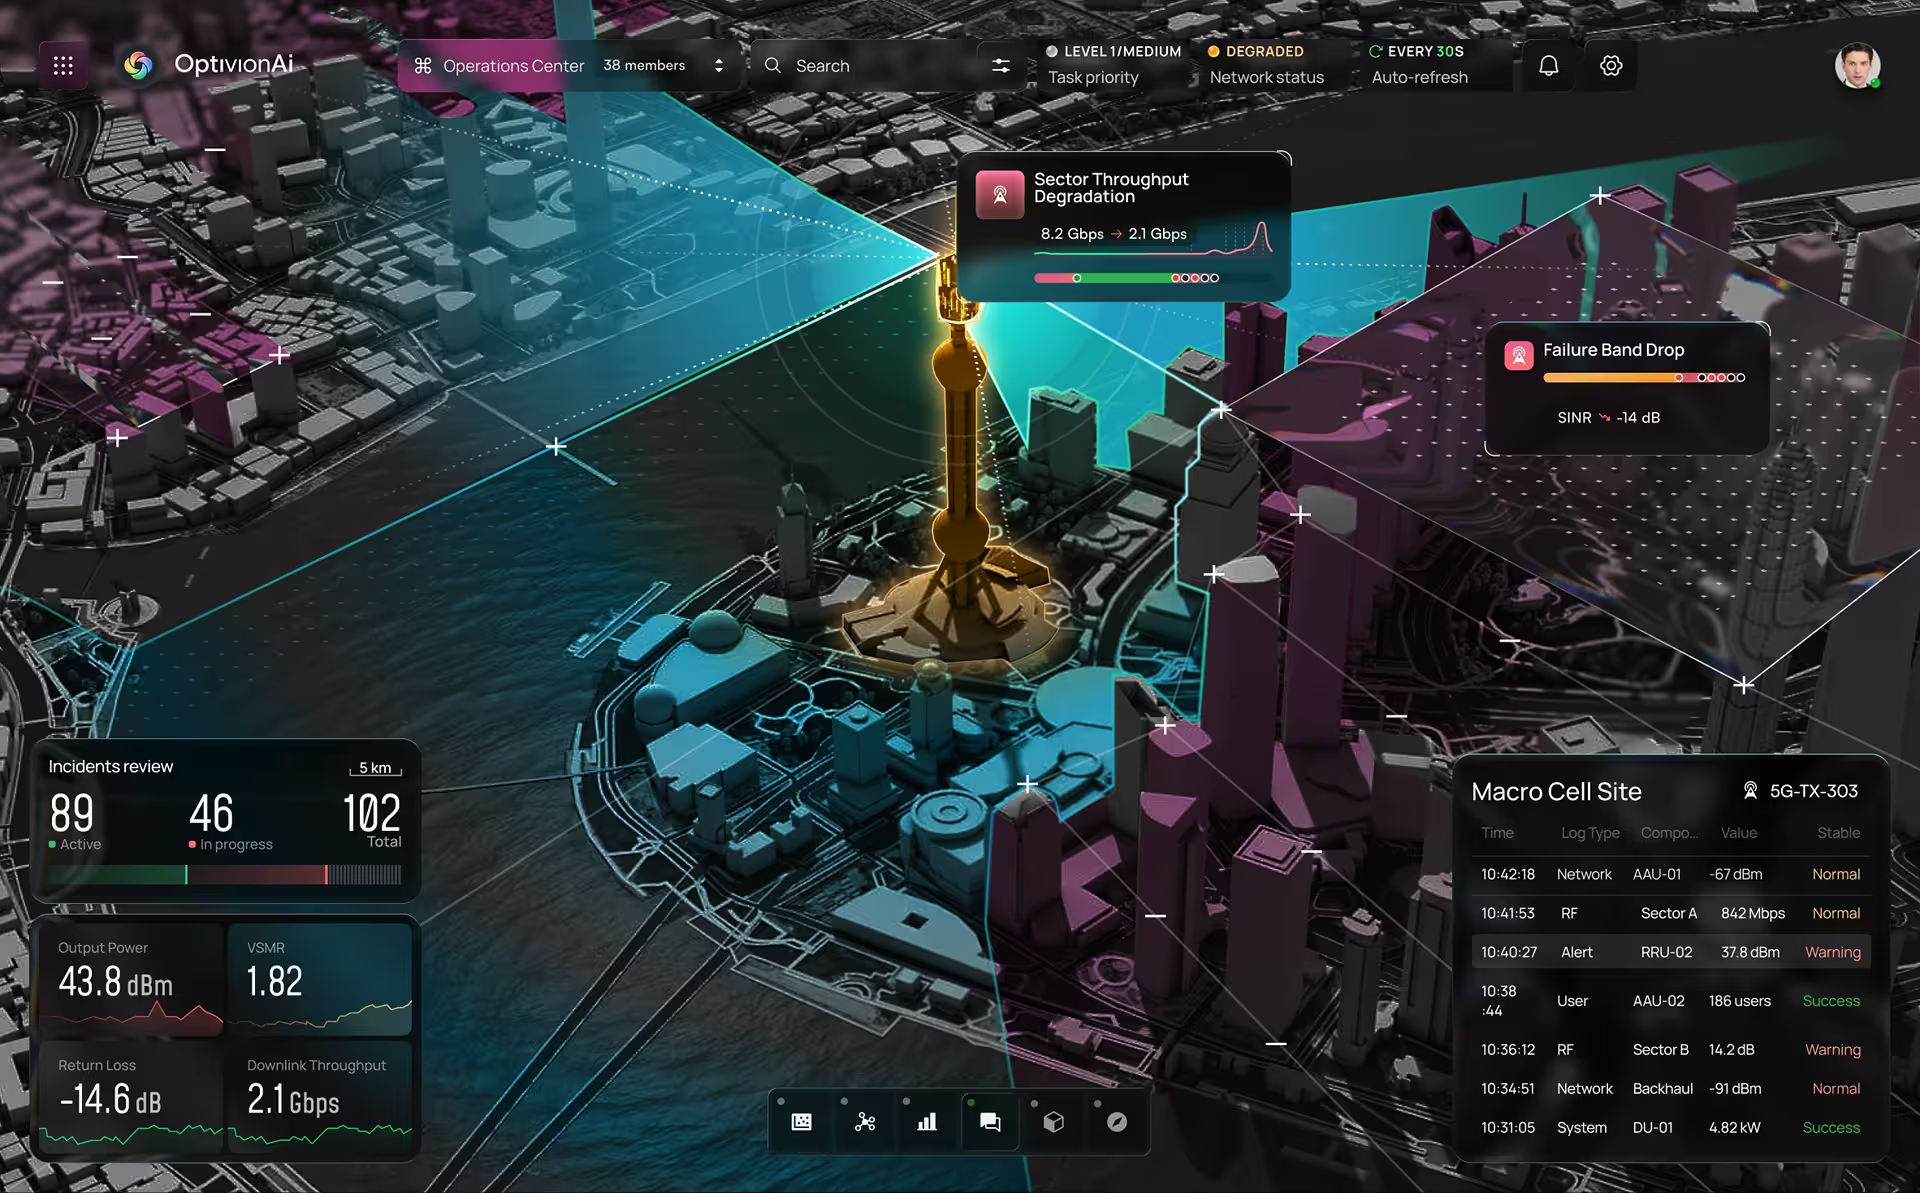
From national map to antenna module

We are a SaaS design
company that sticks
to our principles
<span class="highlighted"><small>Users don't come first</small></span><br>Business Comes

Users don't come first
Business Comes

Being user-centered is valuable — but it’s valuable because it drives business success.
<span class="highlighted"><small>Structure is key</small></span><br>But Good UI Matters

Structure is key
But Good UI Matters

Understanding the relationship between function and design is the art of great UI/UX. Finding the sweet spot is what we do best.
<span class="highlighted"><small>Design is a process</small></span><br>Not An Event

Design is a process
Not An Event

There’s no place for overnight success. We work in short iterations, moving to the result bit by bit, and expect your consistent feedback.
Ready to work with us?

Contact Us

Featured projects

More data-visualisation work for the public sector and other complex, high-stakes domains.