Data visualization examples from real products, explained
Data visualization examples are finished charts, maps, and interface screens that show how a team turned one dataset into something a person can read and act on. Most published lists pull them from newsrooms and public datasets, yet a single California Department of Health Care Services dataset needed three separate chart types before non-technical state staff could use it without any training.
What makes data visualization examples worth studying
Data visualization examples are worth studying when they pass what we at Fuselab Creative call the decision test. You can name the decision the screen supports, the data constraint it works under, and the encoding choice that makes that decision fast. When one of the three is missing, the example teaches styling rather than judgment, and styling transfers worst between products.
Most collections of data visualization design examples are built the other way around. Year-end favorites from newsrooms and catalogs of chart types are excellent on craft, but they rarely say who acted on the chart or what that person was trying to decide. A beautiful flow diagram of public survey data tells you little about what a nurse or network engineer reads under pressure.
The decision test asks three questions of every screen, in this order:
- The decision. What does the person looking at it choose to do next—dispatch a technician, approve a plan, or flag a county?
- The constraint. What makes the problem hard: data volume, missing context, a noisy environment, a reader with no training, or a phone screen?
- The encoding. Which visual position choice and color, motion, or physical layout carries the decision so the reader gets there in seconds?
The order matters. Teams that start from the encoding end up copying a chart that solved someone else’s problem. Teams that start from the decision can borrow the reasoning and rebuild the visual for their own data. That is the only kind of borrowing that survives contact with a real product and its real users.
One boundary before the examples. Several screens below sit inside larger dashboards, but this guide looks at the visualization layer only: the chart, map or model that carries a decision. The product questions around it—such as roles, permissions, and live data states—belong to a separate discipline, covered in our comparison of dashboard design and data visualization.
Data visualization examples from real products
The eight data visualization examples in this guide come from interfaces people operate at work: telecom networks, policy research, factory floors, clinics, cancer labs, wind farms, aircraft markets and state health programs. Seven come from our client projects, and one is our own studio concept. Each is read through the decision test and ends with one idea worth borrowing.
Every screen here also appears in our gallery of interface design examples, where each one links back to the project it came from. The table gives the short version: the visualization type, the job it does best and the example that shows it. The sections that follow explain the reasoning behind each choice.
3D telecom network view (OptivionAI)
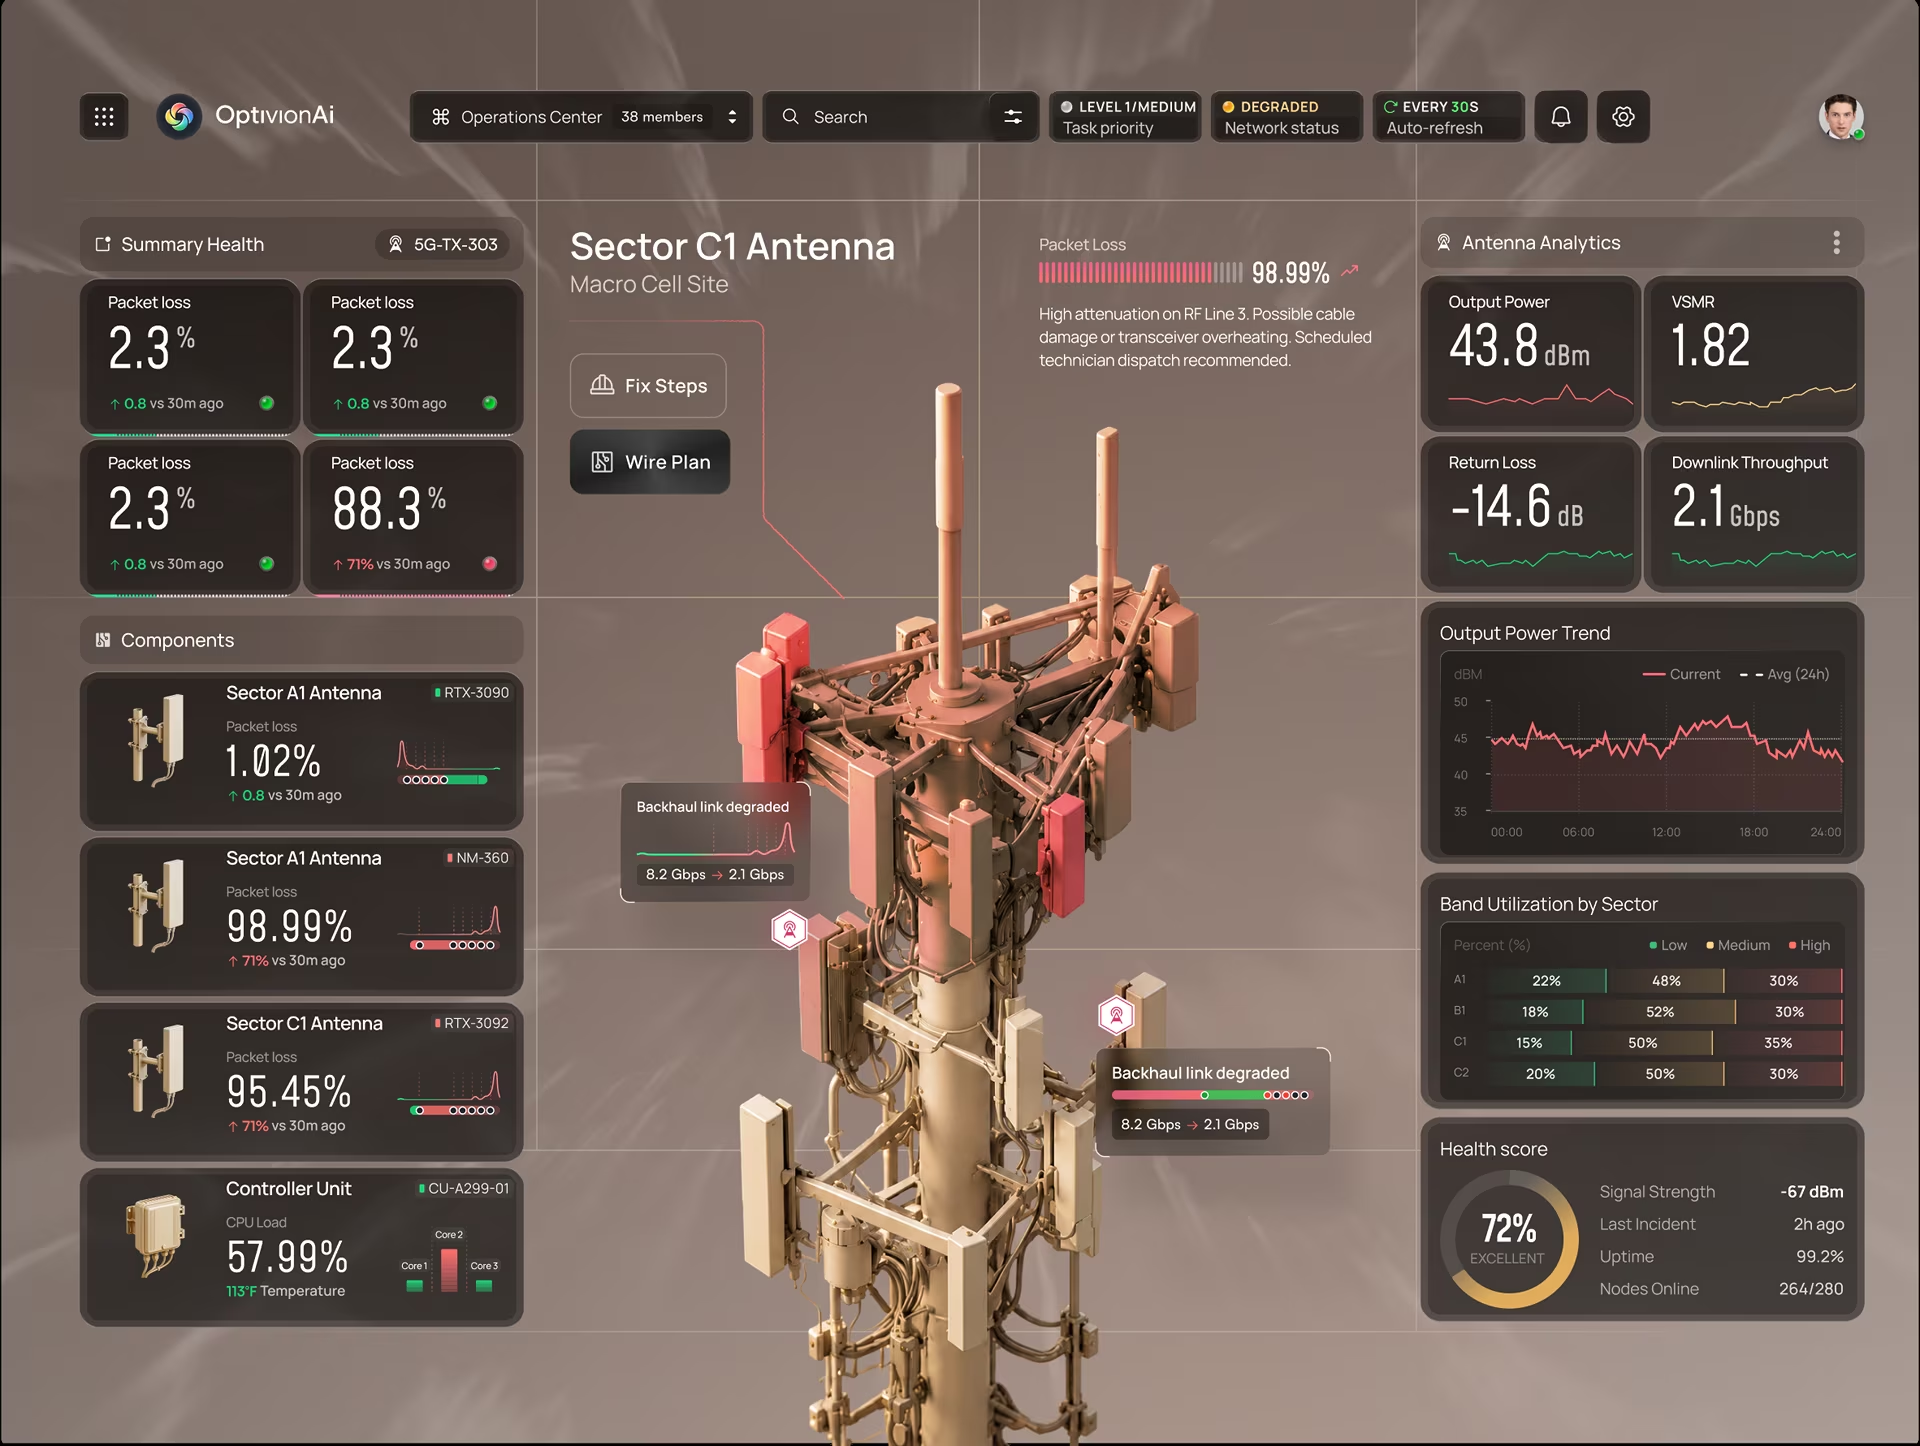
At Fuselab Creative, we designed OptivionAI’s 3D telecom network view, which turns complex infrastructure and live network data into a scene operators can explore. The decision is where a fault sits and what it will take down. An alarm list answers neither, because it reports that something failed without showing the surrounding hardware.
The encoding is the physical site itself. Equipment is drawn where it stands, each component carries its own health score, and a failing radio stands out from the healthy one mounted beside it.
Borrow this: use depth only when the data has a real shape in space, such as a mast, a cabinet, or a cable run.
Policy intelligence platform (Control AI)
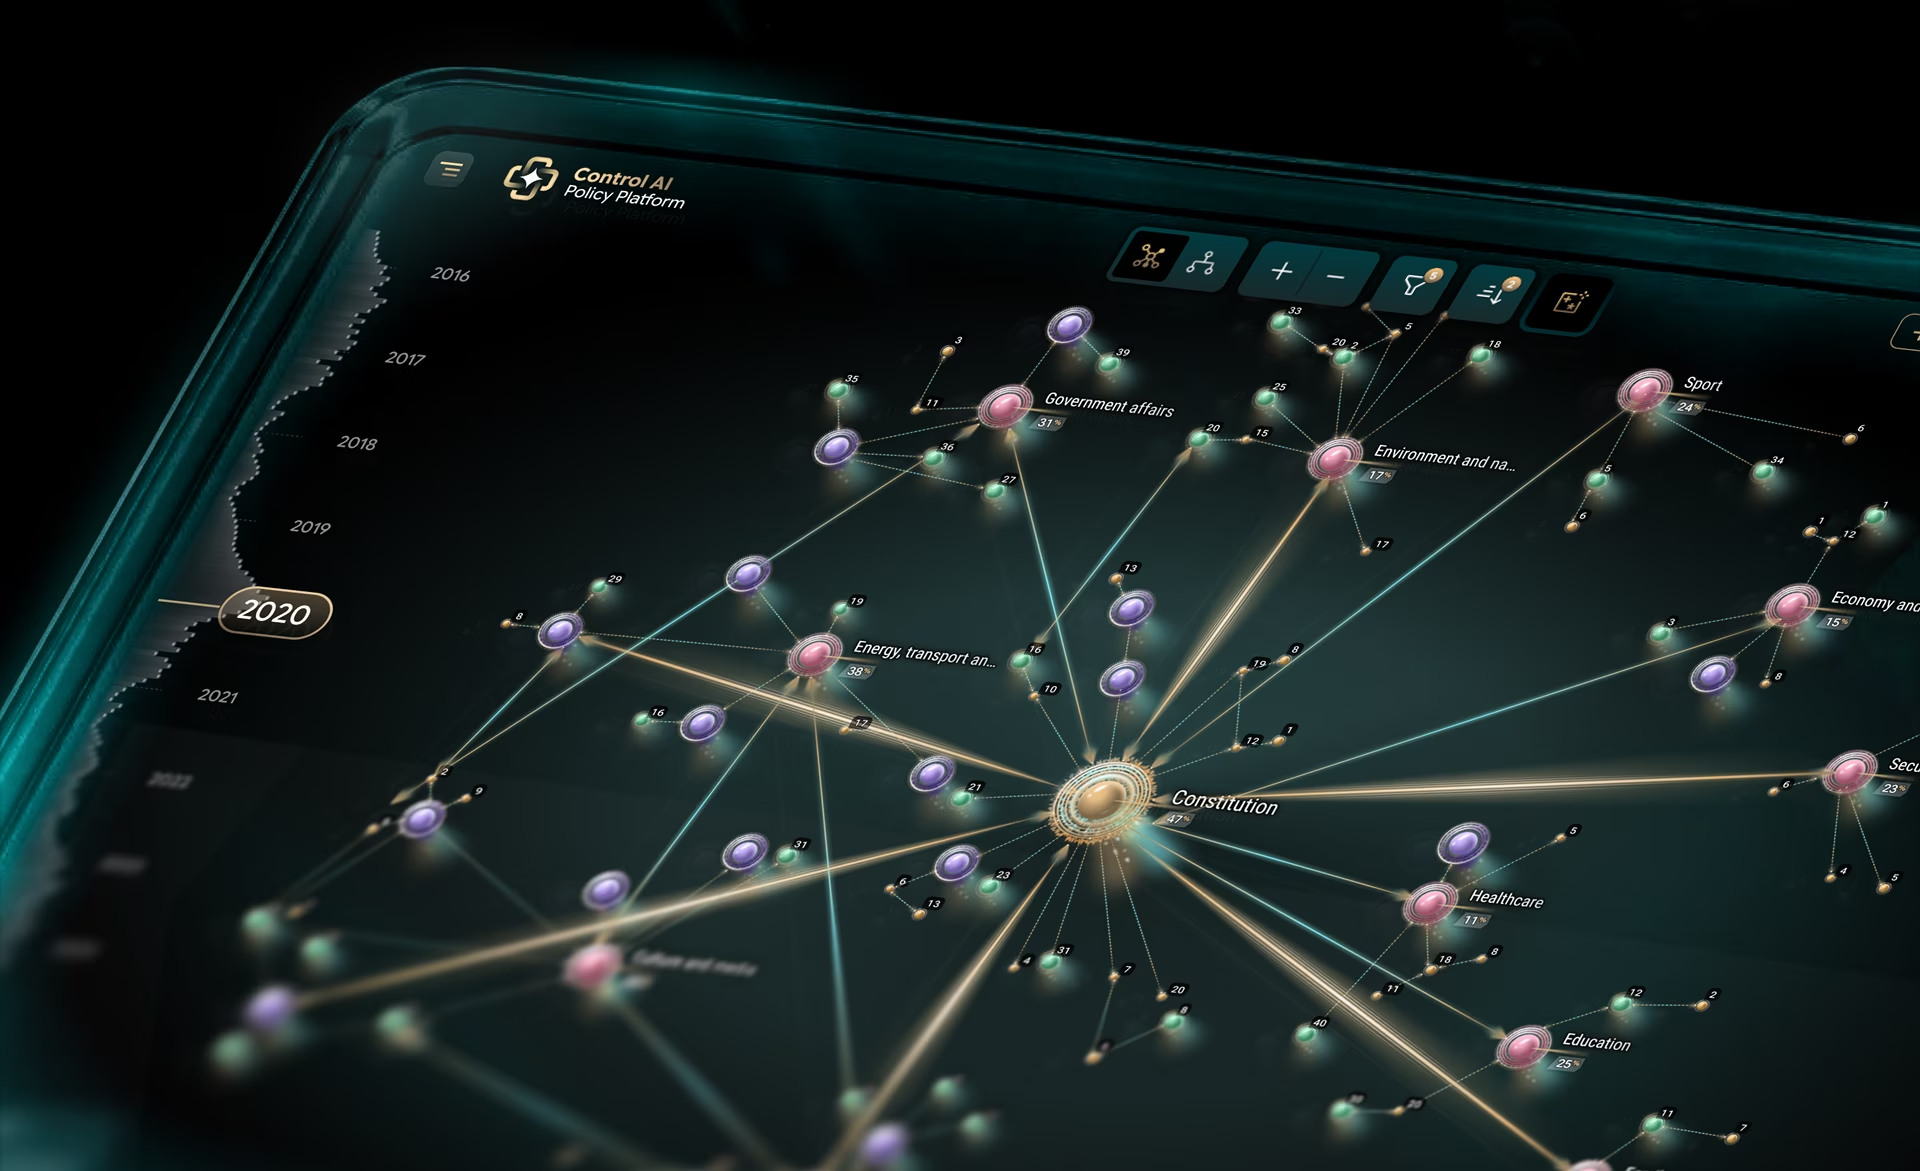
Policy information arrives in fragments: a new law, a speech, a court ruling, a wave of public reaction. We designed the policy constellation graph in Control AI, which connects new laws, events, and public reaction in one view that shows who a change affects. The constraint is depth, since every connection opens another layer.
The core encoding is a force-directed constellation graph centered on the Constitution, with policy domains such as healthcare, energy, and education radiating out as labeled cluster hubs. Gold radial lines carry legal hierarchy, so primacy reads before any label does. A summary metrics panel and drill-down detail cards give readers a way in that skips the full graph.
Borrow this: anchor a network on the node every other node depends on, and let line weight carry the hierarchy. Then give readers a second entry point, such as a summary panel or a search, because a large network graph rewards exploration but punishes anyone arriving with a single, specific question
Real-time manufacturing monitoring (Hyperfab)
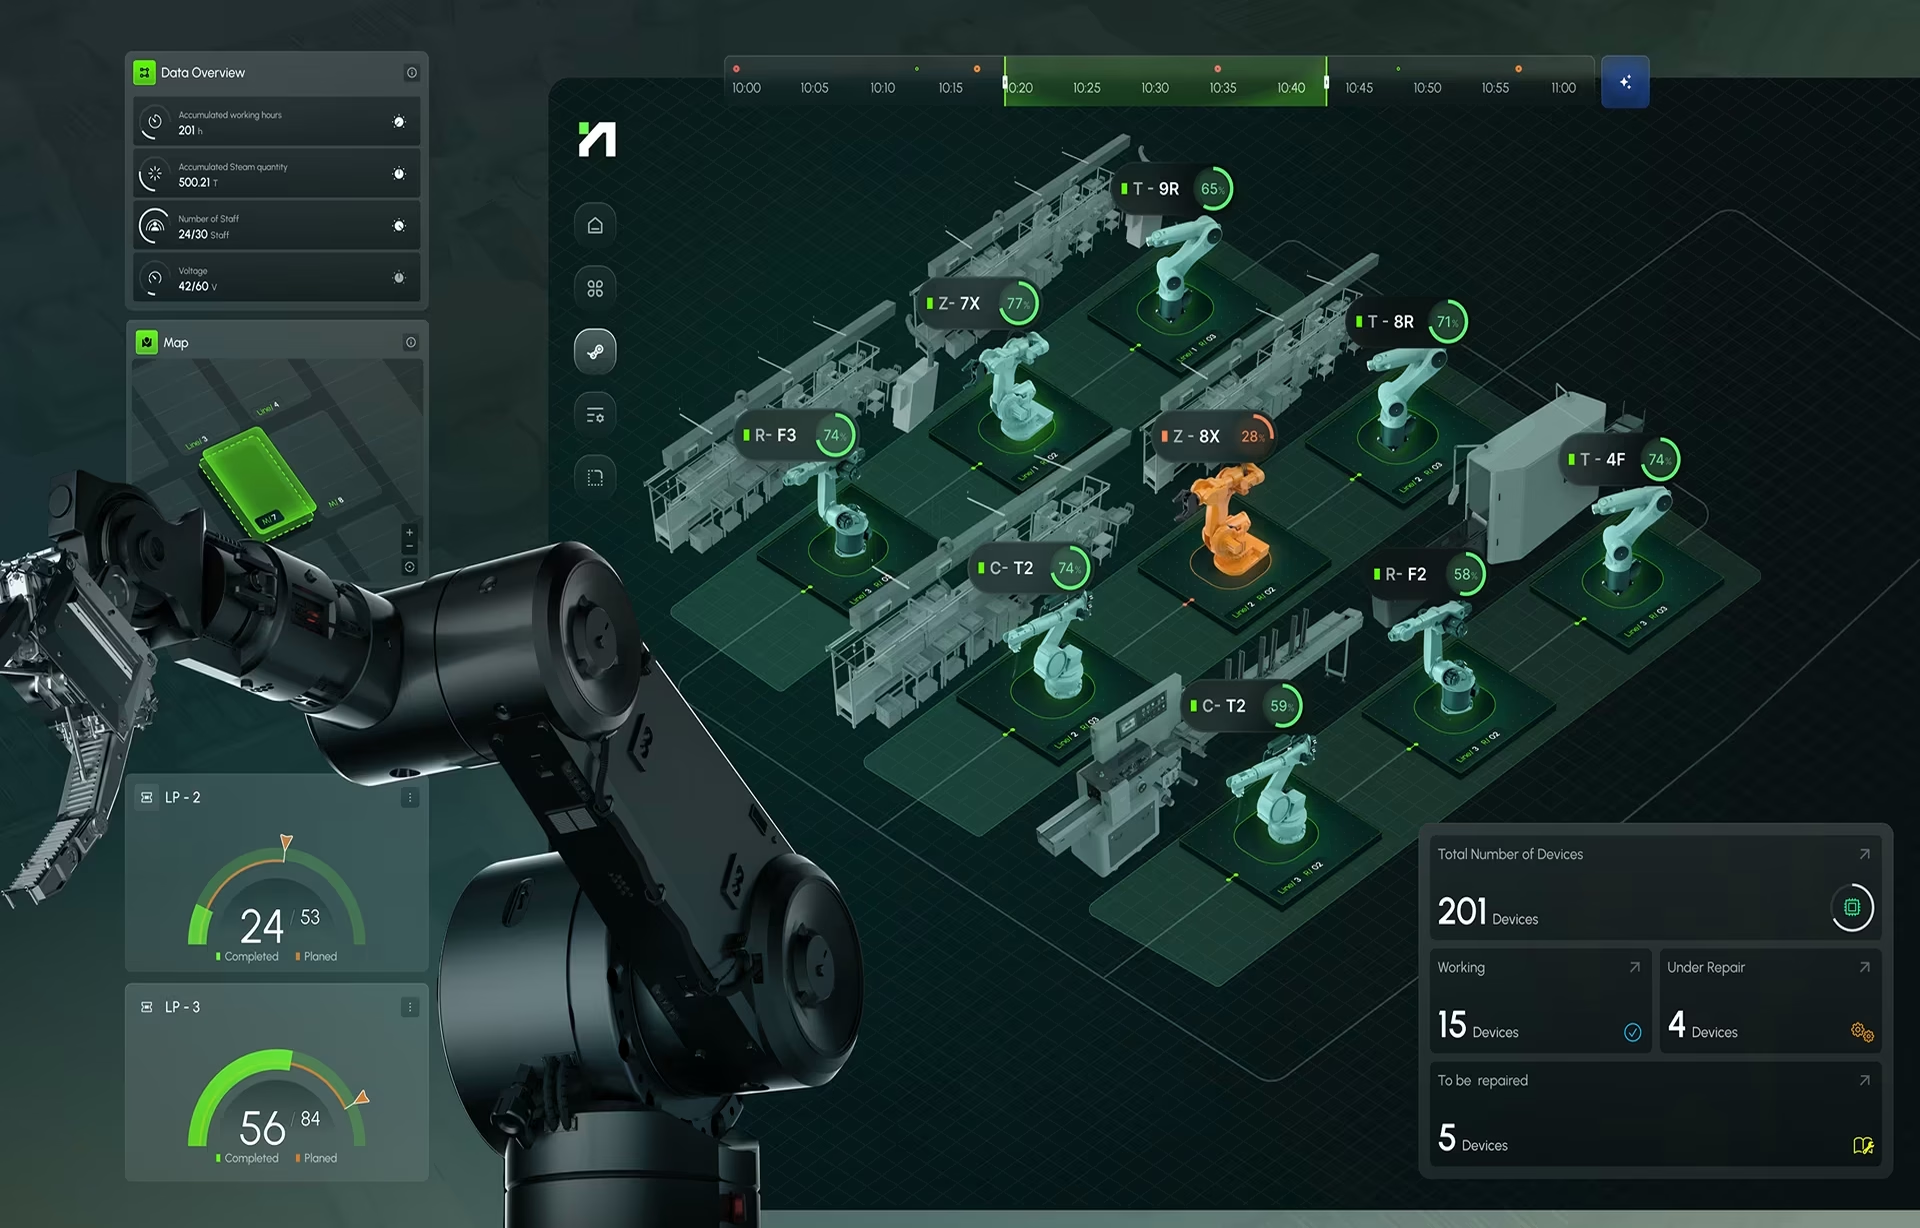
On a production floor, the decision is immediate: which station is falling behind plan, and does someone need to act now? We designed Hyperfab’s production monitoring dashboard, which maps a robotic construction line top-down so floor managers can see where output falls behind plan. A misread status indicator there can stop a line.
The production monitoring view is built in layers, each with one job:
- The line map. Packing, labeling, cutting, and riveting appear as a top-down map that mirrors the real floor.
- The shared timeline. Every event and status change sits on one clock, colored green, yellow or red as operators expect.
- The side rail. Energy use, staffing, and runtime stay visible without competing with the map.
- The bottom band. Actual output runs against plan in real time.
That layout lets floor managers and engineers move from signal to insight to action on one surface.
Borrow this: put every event on one clock. When a machine slows at a given minute, the reader can see what else changed in that same minute, which turns a vague slowdown into a cause someone can fix.
Health data in motion (ClyHealth)
A single lab result means little on its own. What a clinician needs to know is whether it is moving, and in which direction. We designed the animated health data view in ClyHealth, which shows at a glance whether a patient’s clinical metrics are improving or getting worse. It serves providers under time pressure and patients without medical training.
We answered that with layered depth and motion. Critical indicators load without a click, clinical detail sits one action away, and full history sits deeper. Animation marks the change itself, so a shifting value draws the eye before anyone reads a number. A view comparing body systems against the patient’s actual age turns complex biomarkers into one comparison.
Borrow this: animate the change, not the chart. Motion that plays on every load becomes decoration the reader learns to ignore. Motion that plays only when a value crosses a range or changes direction becomes a signal, which is exactly what a provider needs from a screen they check between appointments.
AI cancer research platform (qGen)
Choosing a drug or therapy to study means understanding how drugs, proteins, genes, and cancer types relate across a field that keeps changing. We designed the target network in qGen Health Lab, which maps the relationships between drugs, proteins, genes, and cancer types for medical researchers. Those researchers also need repeatable, provable results.
The target network shows drugs, therapies, and cancer conditions as one connected map, so researchers can see the full disease spectrum before narrowing in. Selecting a path, such as Cetuximab and the EGFR receptor it targets, brings up 3D visuals with informational overlays. A separate drug screening view sorts strong interactions from weak ones with high-contrast color and iconography.
Borrow this: in a dense relationship network, let the reader choose a path and push everything else into the background. The full network answers what exists. The selected path answers what to test next, and that second question is the one the researcher actually came to the screen with.

Wind energy monitoring (concept)
We built this wind farm monitoring screen as a studio concept, not a client project, to show live turbine performance and its causes together. At the start of a shift, is the wind farm performing normally, and if not, why? Wind changes by the minute and output follows it, so the reader needs the reading and its explanation on the same screen.
We put the turbine at the center of the concept and arranged everything else around it. Modular cards carry energy production, wind intensity, wind speed, temperature and emissions, one job per card, with small trend charts that only answer whether a value is rising or falling. A single orange accent marks energy activity, and quiet motion shows the system is live.
Borrow this: start the screen from the physical asset instead of a grid of numbers. A reader who sees the turbine first reads the production card as an outcome, then reads the wind cards as the reason behind it. The layout answers the next question in the order people actually ask it.
Aircraft valuation (Aircraft Bluebook)
Aircraft buyers, lenders and insurers face a valuation decision where thousands of details move the price: modifications, maintenance records, utilization, even the paint scheme. We designed the valuation comparison dashboard for Aircraft Bluebook, which lines up aircraft side by side so professionals can see how each detail moves the price.
Two encodings carry the decision. A side-by-side comparison dashboard aligns the same attributes for each aircraft, so differences read across a row instead of from memory. A detailed price report pairs historical trends with clear figures, and the valuation responds as a user adds features such as new avionics or winglets. A dark mode toggle serves pilots in harsh light.
Borrow this: when the decision is a comparison, align the attributes and let each option change the answer in place. Saved valuations, stored as thumbnails a user can reopen later, matter just as much here, because a valuation is rarely settled in one sitting and starting over on each visit wastes a professional’s time.
One dataset, three charts (DHCS)
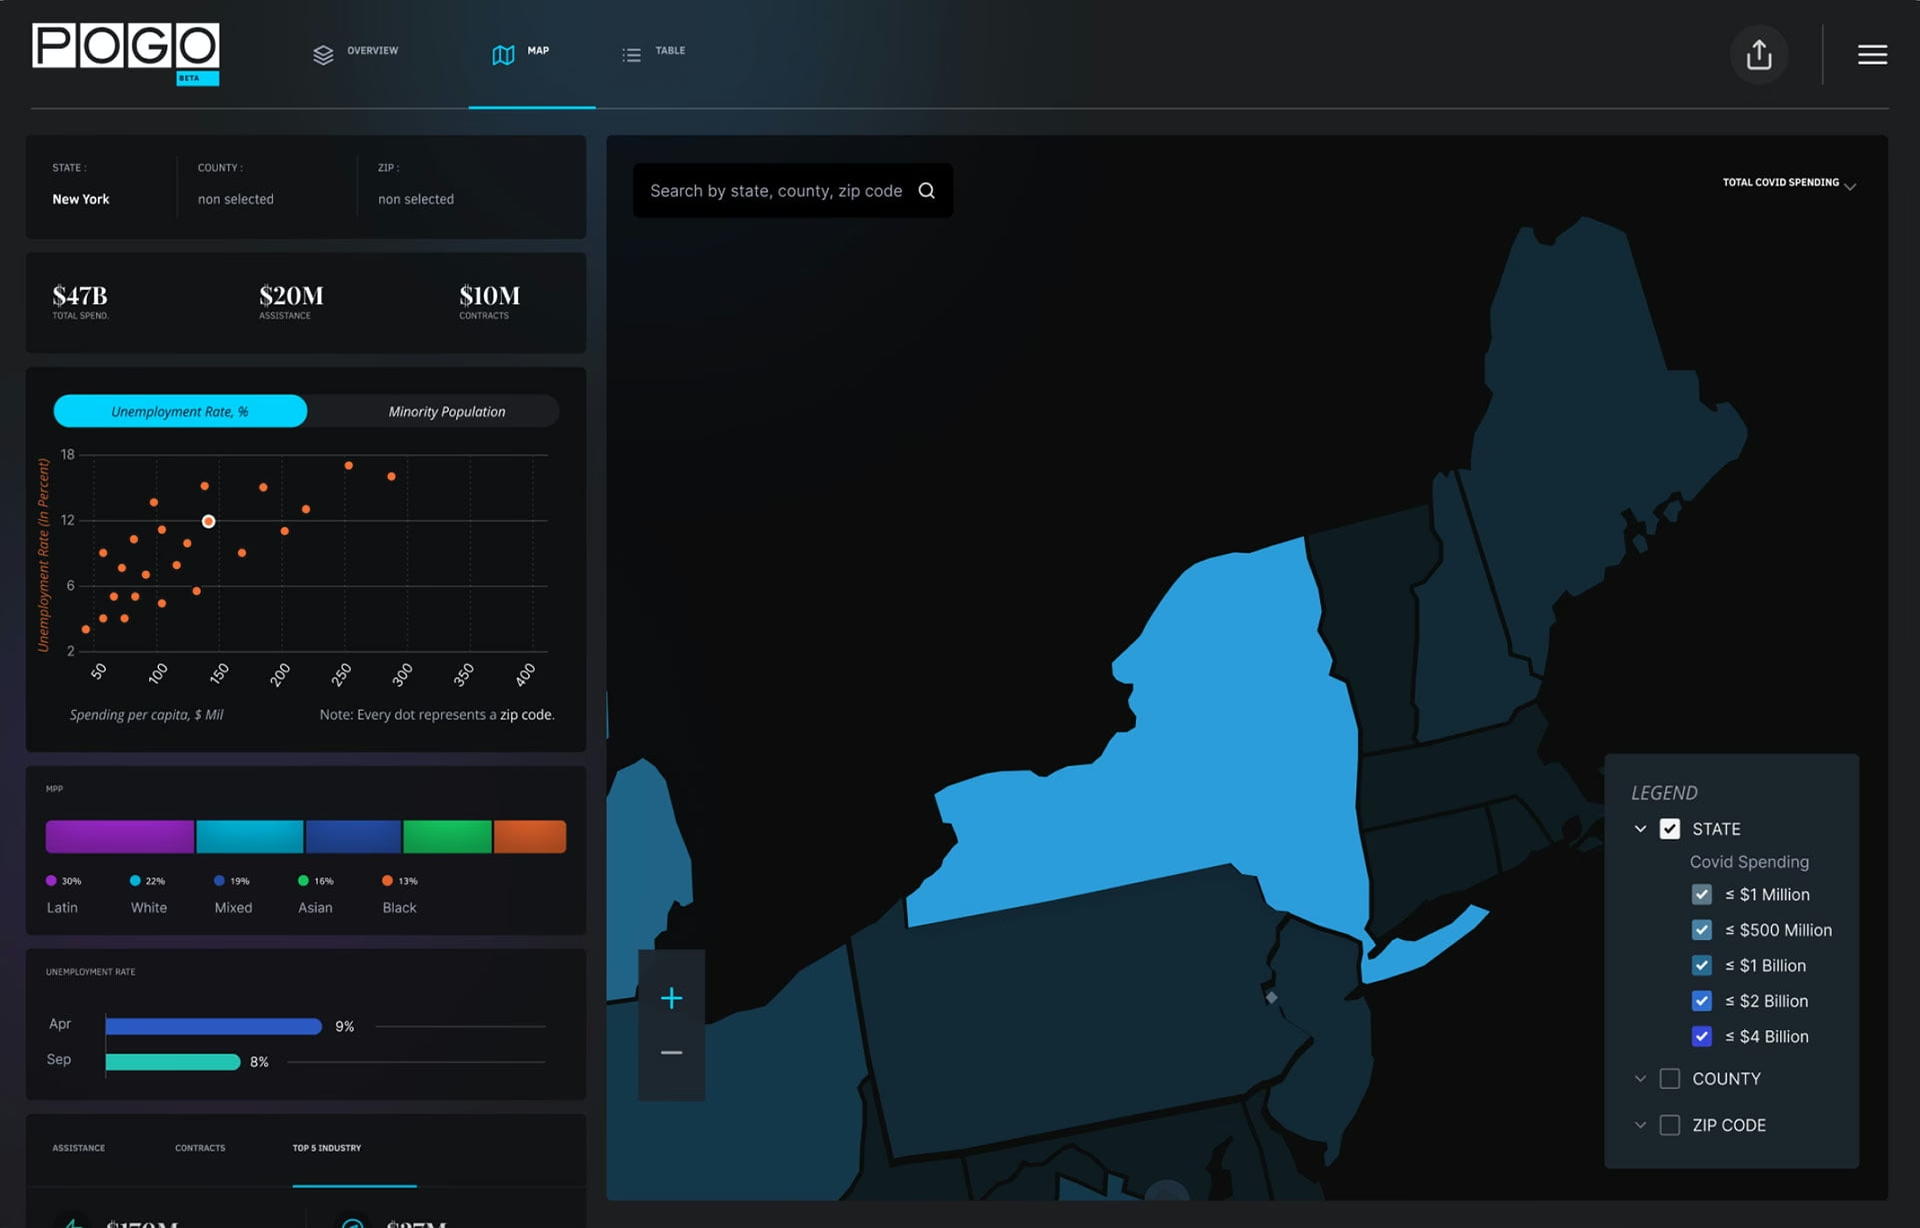
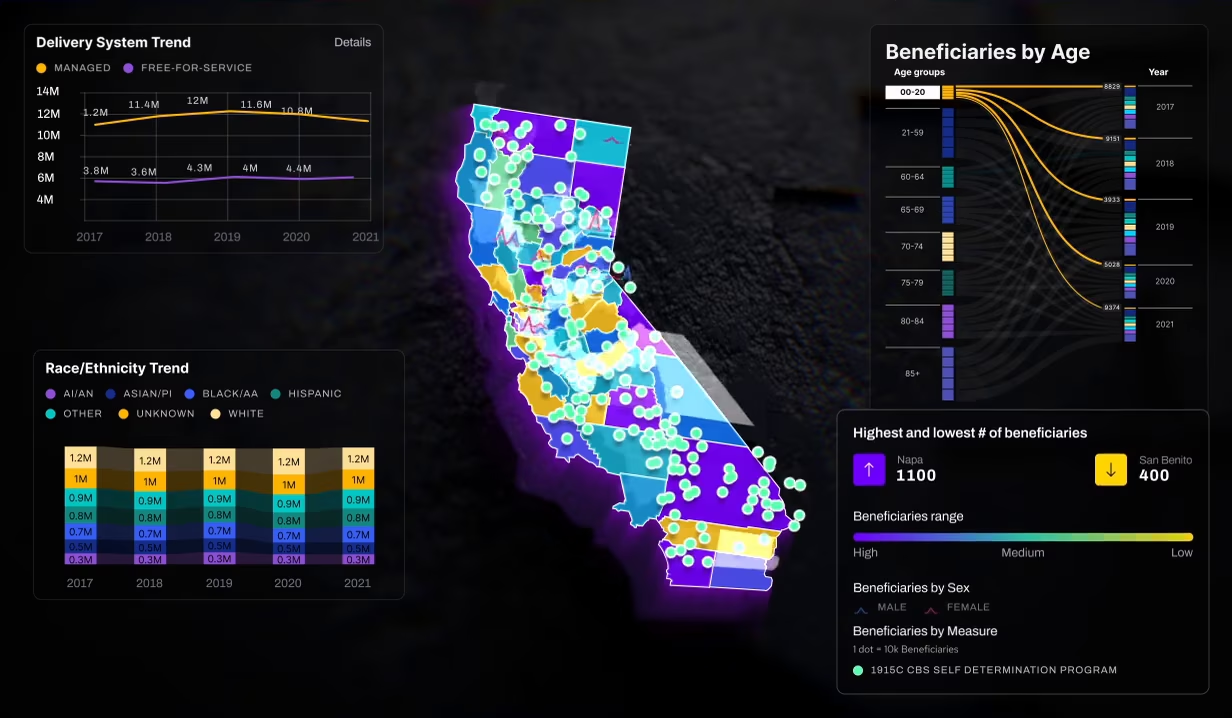
We designed the disparity dashboards for the California Department of Health Care Services, which turn data on long-term services and supports into charts non-technical government stakeholders can read. Readers need to filter by county, ethnicity, language, age group and delivery system, on desktop and mobile, without training. The hardest constraint is the reader, not the data volume.
Each data dimension got the chart that matched its structure:
- Choropleth map for counties. Geographic spread reads straight from color density.
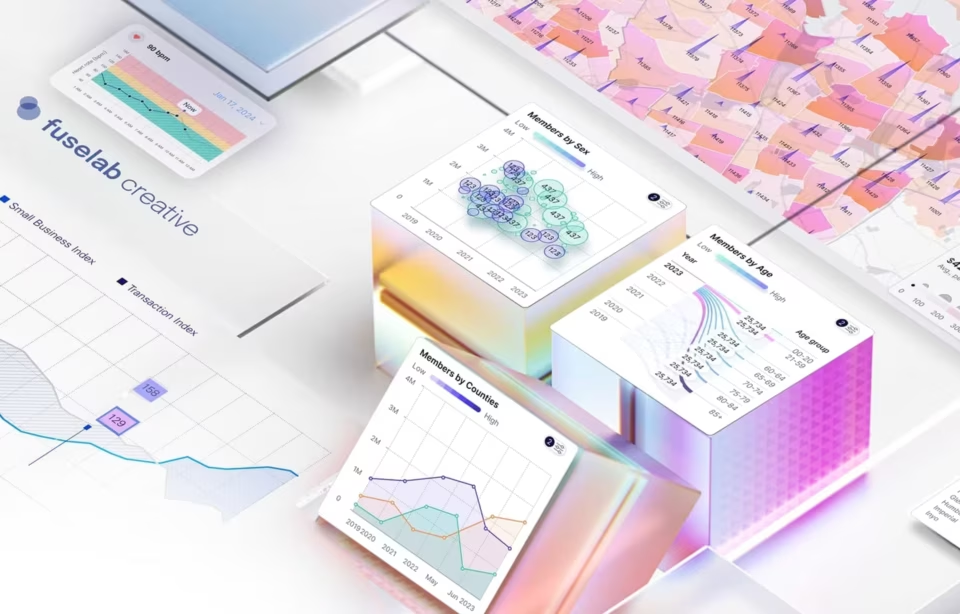
- Sankey diagram for age groups. Band width carries proportion across years, with an average added as a reference point.
- Bubble plot for ethnicity and language. Seeing which groups are moving matters more here than precise size.
Borrow this: choose the chart per data dimension, not per dashboard. On mobile, the layout leads with the choropleth and the Sankey, the two views stakeholders reference most in presentations, and keeps filtering fully interactive. We set that priority from how the people who use the dashboards actually work, not from screen size alone.
Static vs interactive examples: when interaction earns its place
Interaction earns its place when different readers bring different questions to the same data. A static chart is the better choice when everyone needs the same answer, because it can be read, printed and shared without losing anything. The rule from the examples above is simple: one shared question gets a fixed view, and many questions get controls.
DHCS shows the first case clearly. A county health official and a state analyst open the same dashboard looking for different counties and different groups, so the filters are the product. The wind farm concept leans the other way. Almost every reader asks whether the farm is running normally, so most of its value sits in a fixed, glanceable layout.
Interaction also has a cost that interactive data visualization examples rarely show. Every filter creates a state the reader has to remember, and a screenshot of a filtered view can be mistaken for the whole picture. In qGen, we made the selected path visibly distinct from the background network, so the reader always knows they are looking at a subset.
A useful middle ground is guided interaction. In Hyperfab, our simulation preview lets operators play back a robotic cutting path with timeline controls before it runs, which is interaction with a single purpose and a clear end. Open-ended exploration suits researchers well but tends to frustrate operators, because operators arrive with a task rather than with curiosity.
What weak data visualization examples have in common
Weak data visualization examples share one trait: they show the output and hide the decision. The chart is polished, the palette is pleasing, and nobody can say who acted on it or what changed because of it. Without that context, a reader can admire the example but cannot tell whether its choices fit their own product.
Three warning signs show up again and again:
- The data is public and static, so the example never had to survive a late feed or a missing value.
- The screen shows only the ideal state, with no empty, loading or filtered version.
- The chart type was chosen for novelty, and the same message would have read faster as a plain bar or line.
The fix is usually not better styling. Rules for chart choice, labeling, color and axis honesty are covered in our guide to data visualization best practices, so they are not repeated here. The narrower point for anyone collecting references is to discard an example when you cannot reconstruct the decision behind it, however good it looks.
How to judge an example before you copy it
Judge an example by whether its reasoning transfers to your product, not by how it looks. Good data visualization examples hold up when you can match their decision and constraint to your own, then borrow the encoding logic and rebuild the visual for your data, your readers and your screen sizes.
Before an example goes into a mood board or a brief, run it through five checks:
- Name the decision in one sentence. If you cannot say what the reader does next, the example has nothing to teach about function.
- Compare the constraints. A wind farm screen read at the start of a shift and a clinical screen read between appointments face different pressures, so check whether yours match either one.
- Find the encoding that carries the decision. Ask whether position, color, motion or physical layout does the work, and whether that channel suits your data.
- Check the chart type against a reference. The Data Viz Project sorts chart types by function and data input, and the FT Visual Vocabulary groups them by the relationship in the data.
- Borrow the reasoning, then rebuild. Copying a screen copies its constraints too, including the ones your product does not have.
Running these checks takes minutes and prevents a slower mistake: a redesign built on a reference that solved a different problem. When an example fails the first check, keep it for visual style if you like, but do not let it shape the structure, the hierarchy or the choice of chart on your own screen.
Frequently asked questions
What is a data visualization example?
A data visualization example is a finished chart, map or interface screen that shows how a specific dataset was turned into something a reader can understand and act on. Data visualization examples are most useful when they come with context: who reads the screen, what they decide from it, and why the designer chose that chart type.
What is interactive data visualization?
Interactive data visualization lets the reader change what a chart shows by filtering, zooming, selecting or playing data back over time. It suits datasets where different readers bring different questions, such as a state health dashboard filtered by county. The trade-off is hidden state, so a good interactive view always shows which filters are applied.
What is the difference between a data visualization example and a template?
A data visualization example shows a solved problem, with the decision, constraint and encoding choices that produced the screen. A template is an empty structure built for reuse, with no data or reader behind it. Examples teach reasoning you can adapt, while templates give you a starting layout that still needs those decisions made.
Are interactive data visualizations better than static ones?
Interactive data visualizations are better only when readers ask different questions of the same data. When everyone needs the same answer, a static chart is faster to read, easier to share and harder to misread. Many strong products combine both, with a fixed overview for the common question and controls for readers who need more.
Where can I find data visualization examples for inspiration?
The best data visualization examples for inspiration come from sources that explain the reasoning, not only the result. Our Get Inspired gallery at Fuselab Creative shows product screens alongside the project behind each one. The Data Viz Project catalogs chart types by function, and the FT Visual Vocabulary helps match a chart to the relationship in your data.
How do you choose the right visualization for complex data?
Choosing a visualization for complex data starts with splitting the data into dimensions and giving each one the chart that matches its structure. Geography suits a map, proportional flow across categories suits a Sankey diagram, and change across many groups suits a bubble plot. One complex data visualization rarely answers everything well, so plan several.
What should you look for in an agency's data visualization portfolio?
An agency’s data visualization portfolio should pass the decision test. For each project, the agency can name the decision the screen supports, the data constraint it works under and the encoding that makes the decision fast. Ask to see one screen that failed in testing and what replaced it, because that answer shows judgment screenshots cannot.